

Towards a rational strategy for monitoring of microbiological quality of ambient waters
- PMID: 22771467
- PMCID: PMC4492939
- DOI: 10.1016/j.scitotenv.2012.06.019
Towards a rational strategy for monitoring of microbiological quality of ambient waters
Abstract
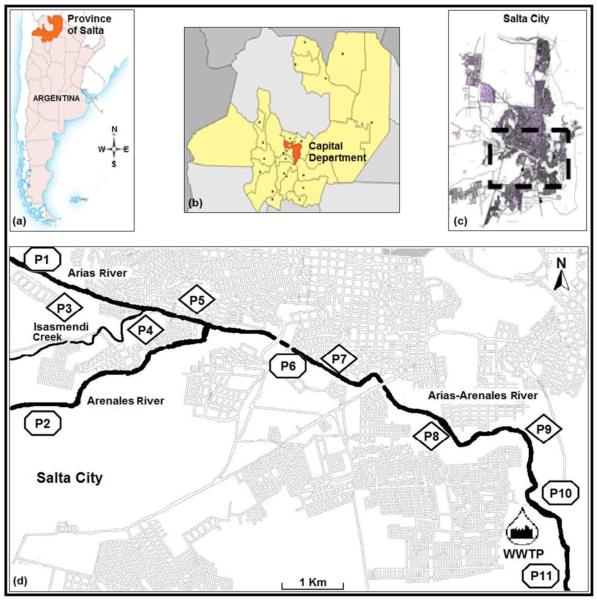
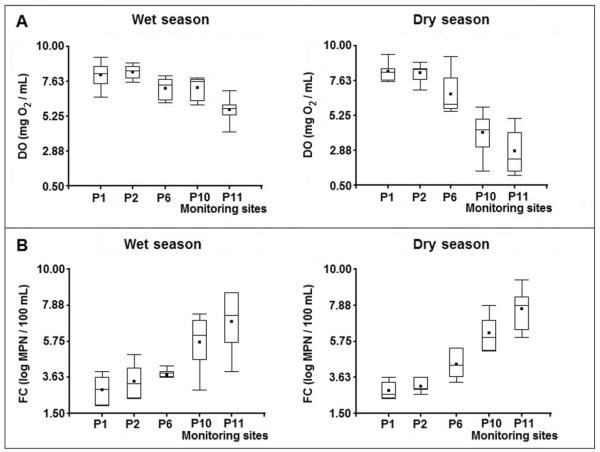
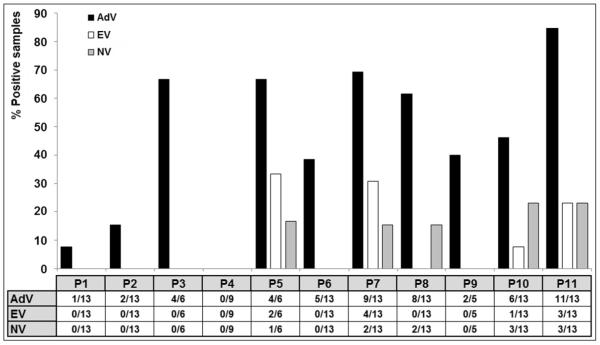
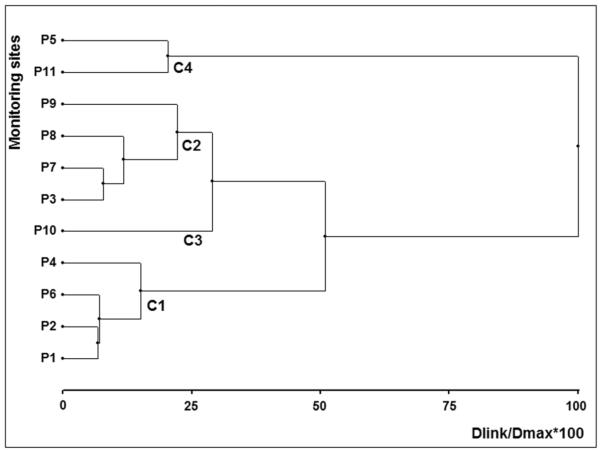
Water is one of the main sources of human exposure to microbiological hazards. Although legislation establishes regulatory standards in terms of fecal indicator bacteria to assess the microbiological quality of water, these do not necessarily predict the presence of pathogens such as parasites and viruses. Better surveillance and management strategies are needed to assess the risk of pathogens' waterborne transmission. We established a baseline dataset to characterize river water quality, identify changes over time, and design a rational monitoring strategy. Data from a year-long monthly monitoring campaign of the polluted Arenales River (Argentina), were analyzed to statistically correlate physicochemical and microbiological variables, the seasonal and longitudinal variations of the water quality and determine the similarity between study sites. The measured variables (sixteen) reflected the deterioration in the river quality through the city. Different viruses and parasites found did not correlate with the concentration of total and thermotolerant coliforms. There was significant seasonal variation for temperature, turbidity, conductivity, dissolved oxygen, enterococci, and norovirus. Strong correlations between some variables were found; we selected eight variables (dissolved oxygen, conductivity, turbidity, total and thermotolerant coliforms, Enterococcus, and adenovirus and Microsporidium as viral and parasitological indicators, respectively) for future monitoring. There was similarity between the monitoring locations, which were grouped into four clusters validated by cophenetic correlation and supported by discriminant analysis. This allowed us to reduce the number of sites, from eleven down to five. Sixty seven percent of the total variance and the correlation structure between variables were explained using five principal components. All these analyses led to a new long-term systematic monitoring scheme. A rational monitoring strategy based on the selection of the most suitable monitoring points and of the most significant variables to measure, will result in optimal use of the limited resources available to adequately protect the public and environmental health.
Copyright © 2012 Elsevier B.V. All rights reserved.
Figures
References
-
- Albinana-Gimenez N, Miagostovich MP, Calgua B, Huguet JM, Matia L, Girones R. Analysis of adenovirus and polyomaviruses quantified by a PCR as indicators of water quality in source and drinking-water treatment plants. Water Res. 2009;43:2011–2019. - PubMed
-
- Aramayo CF, Gil JF, Cruz MC, Poma HR, Last MS, Rajal VB. Diarrhea and parasitosis in Salta, Argentina. J Infect Devel Countries. 2009;3(2):105–111. - PubMed
-
- Ayed LB, Schijven J, Alouini Z, Jemli M, Sabbahi S. Presence of parasitic protozoa and helminth in sewage and efficiency of sewage treatment in Tunisia. Parasitol Res. 2009;105:393–406. - PubMed
Publication types
MeSH terms
Substances
Grants and funding
LinkOut - more resources
Full Text Sources
Molecular Biology Databases
