. 2012 Sep;26(9):1617-29.
doi: 10.1210/me.2012-1183. Epub 2012 Jul 6.

Association with nitric oxide synthase on insulin secretory granules regulates glucokinase protein levels

Affiliations

Association with nitric oxide synthase on insulin secretory granules regulates glucokinase protein levels

Michele L Markwardt et al. Mol Endocrinol. 2012 Sep.

Abstract

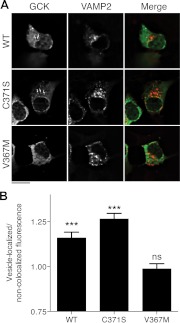
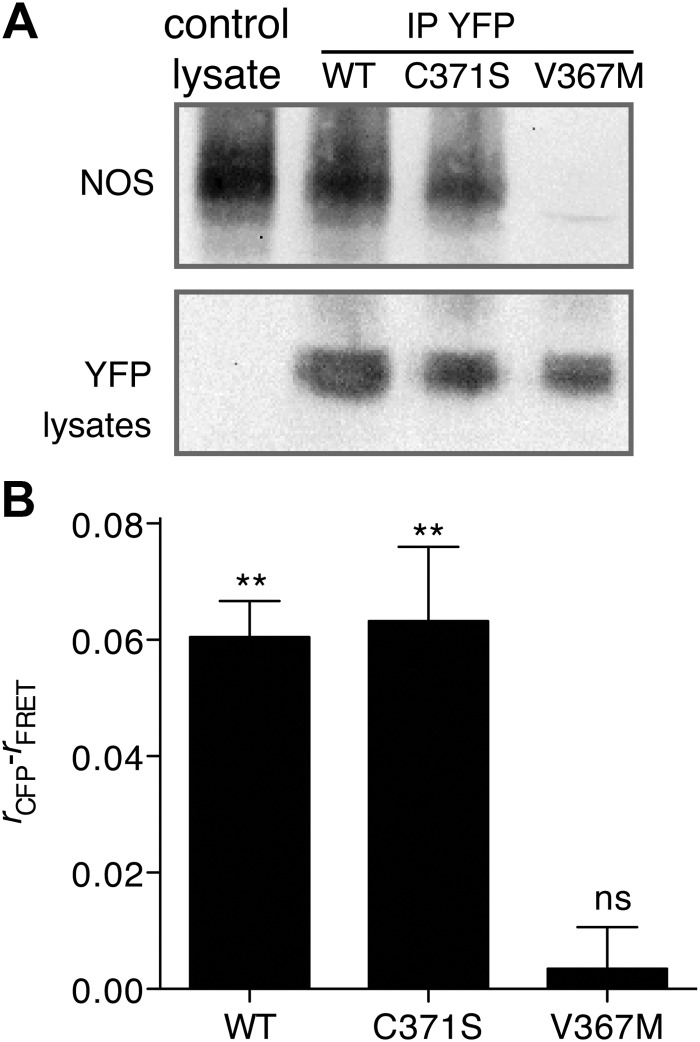
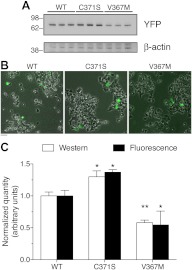
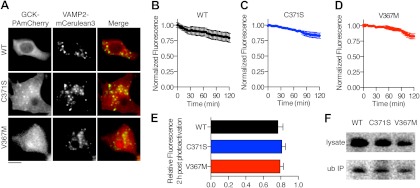
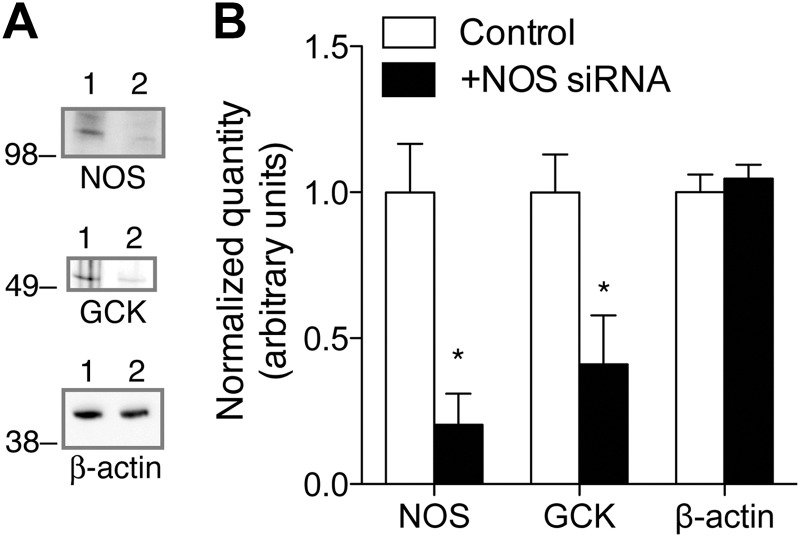
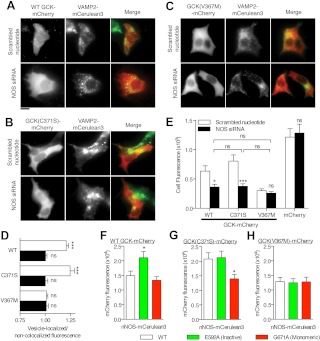
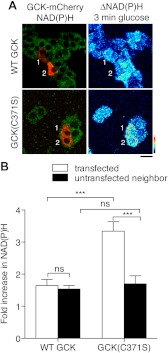
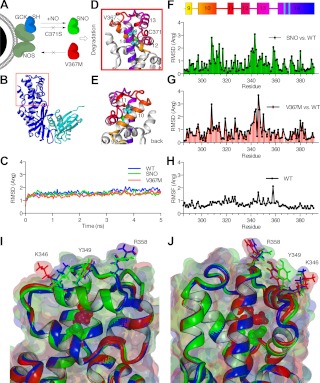
Glucokinase (GCK) association with insulin-secretory granules is controlled by interaction with nitric oxide synthase (NOS) and is reversed by GCK S-nitrosylation. Nonetheless, the function of GCK sequestration on secretory granules is unknown. Here we report that the S-nitrosylation blocking V367M mutation prevents GCK accumulation on secretory granules by inhibiting association with NOS. Expression of this mutant is reduced compared with a second S-nitrosylation blocking GCK mutant (C371S) that accumulates to secretory granules and is expressed at levels greater than wild type. Even so, the rate of degradation for wild type and mutant GCK proteins were not significantly different from one another, and neither mutation disrupted the ability of GCK to be ubiquitinated. Furthermore, gene silencing of NOS reduced endogenous GCK content but did not affect β-actin content. Treatment of GCK(C371S) expressing cells with short interfering RNA specific for NOS also blocked accumulation of this protein to secretory granules and reduced expression levels to that of GCK(V367M). Conversely, cotransfection of catalytically inactive NOS increased GCK-mCherry levels. Expression of GCK(C371S) in βTC3 cells enhanced glucose metabolism compared with untransfected cells and cells expressing wild type GCK, even though this mutant has slightly reduced enzymatic activity in vitro. Finally, molecular dynamics simulations revealed that V367M induces conformational changes in GCK that are similar to S-nitrosylated GCK, thereby suggesting a mechanism for V367M-inhibition of NOS association. Our findings suggest that sequestration of GCK on secretory granules regulates cellular GCK protein content, and thus cellular GCK activity, by acting as a storage pool for GCK proteins.


Figures

Fig. 1.
Fig. 1.
Accumulation of GCK(C371S), but not GCK(V367M), to insulin-secretory granules. A, βTC3 cells were cotransfected with plasmids encoding WT, C371S or V367M GCK-mVenus, and VAMP2-mCerulean3 to label insulin-secretory granules. Cells were fixed and imaged using wide-field fluorescence microscopy. Z-stacks were deconvolved using the constrained iterative algorithm to generate optical slices. Images show a single optical slice, and the scale bar indicates 10 μm. For the merged image, the GCK image was colored green, and VAMP2 image colored red. The arrows indicate granule-localized structures that are brighter than cytosolic GCK-mVenus fluorescence. B, GCK-mVenus fluorescence was quantified in VAMP2 colocalized regions and normalized to regions lacking VAMP2 fluorescence for cells expressing WT and mutant GCK-mVenus and VAMP2-mCerulean3. Statistical significance from unity was assessed by t test (n = 10 cells analyzed as described in Materials and Methods, mean ± sem; ***, P < 0.001; ns, P > 0.05).
Fig. 2.
Fig. 2.
GCK(V367M) inhibits association with NOS. A, βTC3 cells were left untransfected as a control or transfected with WT, C371S, and V367M GCK-mVenus as indicated. GCK proteins were immunoprecipitated from transfected cells using antifluorescent protein antibodies (YFP) and blotted for NOS as indicated (top). WT and mutant GCK expression from preimmunopreciptiated lysates was confirmed by Western blot using antifluorescent protein antibodies (bottom). B, FRET between GCK-mVenus and NOS-mCerulean in βTC3 cells was determined using the anisotropy FRET microscopy method (23). Fluorescence anisotropies (r) under CFP illumination conditions and FRET illumination conditions (CFP excitation, YFP collection) were calculated. FRET is indicated by a statistically significant reduction in the FRET anisotropy compared with CFP anisotropy (n = 5, mean ± sem, two-tailed t test, difference from zero; **, P < 0.01; ns, P > 0.05). IP, Immunoprecipitation.
Fig. 3.
Fig. 3.
Differences in protein content between WT and mutant GCK proteins. A, βTC3 cells were transfected with plasmid DNA encoding WT, C371S, or V367M GCK-mVenus as indicated. Protein content 48 h after transfection, and after a 3-h glucose starvation, was assessed by Western blot using antibodies to the fluorescent protein tag (YFP) or β-actin as indicated. B, Transfection efficiency of the samples in panel A was assessed using phase contrast and fluorescence imaging. Fluorescence images of WT or mutant GCK-mVenus were pseudocolored green and overlaid with the transmitted light image. Scale bar, 20 μm. C, Band density was quantified from the Western blots performed as in panel A (n = 3) and compared with the total fluorescence of cells expressing WT or mutant GCK-mCherry fusions treated identically. Bars represent the sum fluorescence from 50 cells (n = 3), and error bars indicate sd. Values were normalized to the average WT quantity, and statistical significance was tested by ANOVA for the experiments separately (*, P < 0.05; **, P < 0.01 for mutants vs. WT). A two-way ANOVA did not find significant differences between the assays (P > 0.05).
Fig. 4.
Fig. 4.
Clearance of GCK proteins from the cytoplasm is not affected by C371S or V367M. A, βTC3 cells were transfected with GCK proteins fused to a PAmCherry protein (red in Merge) and VAMP2-mCerulean3 (green in Merge). Red mCherry fluorescence was induced by illumination with a 400-nm LED. Scale bar, 10 μm. B–D, Decay of WT (B), C371S (C), and V367M (D) GCK-PAmCherry fluorescence was quantified over a 2-h period (n >7 cells). E, Remaining fluorescence after 2 h was not significantly different for WT and mutant GCK-PAmCherry, or for the two mutants (ANOVA, P > 0.05; Tukey's multiple comparison test for all possible group pairings). F, Ubiquitinated WT and mutant GCK-Venus were detected by immuoprecipitation (IP) with agarose-conjugated ubiquitin antibodies and Western blot for the fluorescent protein tag. Cell lysates and immuoprecipitates are indicated. ub, Ubiquitin.
Fig. 5.
Fig. 5.
Regulation of GCK protein levels by NOS. A, βTC3 cells were transfected with control, scrambled nucleotide siRNA (1) or siRNA for NOS (2) and examined for NOS, GCK, and β-actin expression via Western blot 40 h after transfection. B, Band densities for control and NOS siRNA-treated cells were quantified. Bar indicates mean ± sem (n = 3). Statistical significance (t test) between control and NOS siRNA-treated groups is indicated by *, P < 0.05.
Fig. 6.
Fig. 6.
Modulating NOS protein levels alters GCK protein levels. A–C, Scrambled nucleotide or NOS-specific siRNA was cotransfected with VAMP2-mCerulean3 and either WT (A), C371S (B), or V367M (C) GCK-mCherry and examined for colocalization by fluorescence microscopy. VAMP2-mCerulean3 was colored green and GCK-mCherry images were colored red in the Merge panels. Identifiable accumulation of GCK and to VAMP2-colocalized structures was only observable in WT and C371S-expressing cells cotransfected with control siRNA. Scale bar, 10 μm. D, GCK-mCherry fluorescence was quantified in VAMP2-colocalized regions and normalized to fluorescence from regions lacking VAMP2 fluorescence in cells expressing the indicated constructs and control (white bars) or NOS-specific siRNA (black bars). Statistical significance from unity was assessed by t test (n =10, mean ± sem; ***, P < 0.001; ns, P > 0.05). E, The mean cellular fluorescence of cells (n = 100) cotransfected with WT and mutant GCK-mCherry and either control or NOS-specific siRNA is shown. Error bars indicate sem. Non-GCK-containing mCherry plasmids were used as a control. Statistical significance was determined by ANOVA (Tukey multiple comparison test for GCK proteins; ns, P > 0.05; *, P < 0.05; ***, P < 0.001); mCherry control was tested separately using a t test (two-tailed; n >100 cells; P > 0.05). F–H, Cellular fluorescence of WT (F), GCK(C371S) (G), and GCK(V367M)-mCherry (H) was quantified in cells coexpressing WT NOS, NOS(E592A), or NOS(G671A). Statistical significance was determined by ANOVA (bars indicate mean ± sem; n >50 cells; Tukey multiple comparison test compared with WT-NOS expression, *, P < 0.05).
Fig. 7.
Fig. 7.
Enhanced glucose metabolism in cells expressing GCK(C371S). βTC3 cells were transfected with WT and C371S GCK-mCherry vectors. NAD(P)H autofluorescence was captured by two-photon fluorescence microscopy. A, Merged image of NAD(P)H autofluorescence (green) and mCherry fluorescence (red) (left panels). The right panels indicate the change in NAD(P)H autofluorescence after a 3-min stimulation with 5 mm glucose. Transfected cells in the NAD(P)H image are indicated by number. Scale bar, 20 μm. The color profile of the pseudocolor LUT for the change in NAD(P)H fluorescence is indicated from low (bottom) to high (top). B, Cells expressing GCK(C371S) show enhanced NAD(P)H autofluorescence after glucose stimulation, represented as a fold increase compared with prestimulated condition (0 mm glucose, 3 h), compared with both neighboring cells lacking mCherry fluorescence, and also cells transfected with WT GCK-mCherry. Statistical significance is indicated by *** (P < 0.001, ANOVA; Tukey multiple comparison test, n = 7 cells for WT, n = 6 for C371S; ns, P > 0.05).
Fig. 8.
Fig. 8.
Conformational changes induced by V367M are similar to those induced by GCK S-nitrosylation. A, association of GCK with NOS is represented schematically. S-nitrosylation of GCK triggers dissociation, and is blocked by direct mutation of the nitrosylated cysteine (C371S). The V367M mutant, however, does not associate with NOS, suggesting conformational similarities to S-nitrosylated GCK (GCK-SNO). B, the S-nitrosylation site is located in the distal end (red box) of the large domain (blue) of GCK. The smaller domain is colored cyan [1v4t.pdb (24)]. C, Backbone RMSD for the simulations are shown for WT, SNO, and V367M structures as indicated. D and E, The boxed region of panel B is shown for the WT structure in two views. Val367 and Cys371 are represented as space-filling balls, and α helixes are colored as indicated in panel F. F and G, RMSD were calculated for individual residues from SNO (F) and V367M (G) structures compared with WT. H, The RMSF of residues in the WT structure during the simulation are represented. I and J, overlays of WT (blue), SNO (green), and V367M (red) are shown from two vantage points. Molecular surfaces are shown in addition to secondary structures depicted by ribbons. V367M and S-nitrosylated Cys371 are represented by space-filling balls. Residues of interest on the exterior surface of GCK are also graphically represented.

Similar articles

Cited by

References

    1. Gloyn AL, Odili S, Buettger C, Njolstad PR, Shiota C, Magnuson MA, Matschinsky FM. 2004. Glucokinase and the regulation of blood sugar. In: Matschinsky FM, Magnuson MA, eds. Glucokinase and glycemic disease: from basics to novel therapeutics. Basel, Karger; 92–109
    1. Matschinsky FM. 2002. Regulation of pancreatic β-cell glucokinase: from basics to therapeutics. Diabetes 51( Suppl 3):S394–S404 - PubMed
    1. German MS. 1993. Glucose sensing in pancreatic islet β cells: the key role of glucokinase and the glycolytic intermediates. Proc Natl Acad Sci USA 90:1781–1785 - PMC - PubMed
    1. Wang H, Iynedjian PB. 1997. Modulation of glucose responsiveness of insulinoma β-cells by graded overexpression of glucokinase. Proc Natl Acad Sci USA 94:4372–4377 - PMC - PubMed
    1. Davis EA, Cuesta-Muñoz A, Raoul M, Buettger C, Sweet I, Moates M, Magnuson MA, Matschinsky FM. 1999. Mutants of glucokinase cause hypoglycaemia- and hyperglycaemia syndromes and their analysis illuminates fundamental quantitative concepts of glucose homeostasis. Diabetologia 42:1175–1186 - PubMed

Publication types