. 2012 Oct 12;423(1):106-22.
doi: 10.1016/j.jmb.2012.06.035. Epub 2012 Jul 3.

Mapping L1 ligase ribozyme conformational switch

Affiliations

Mapping L1 ligase ribozyme conformational switch

George M Giambaşu et al. J Mol Biol. .

Abstract

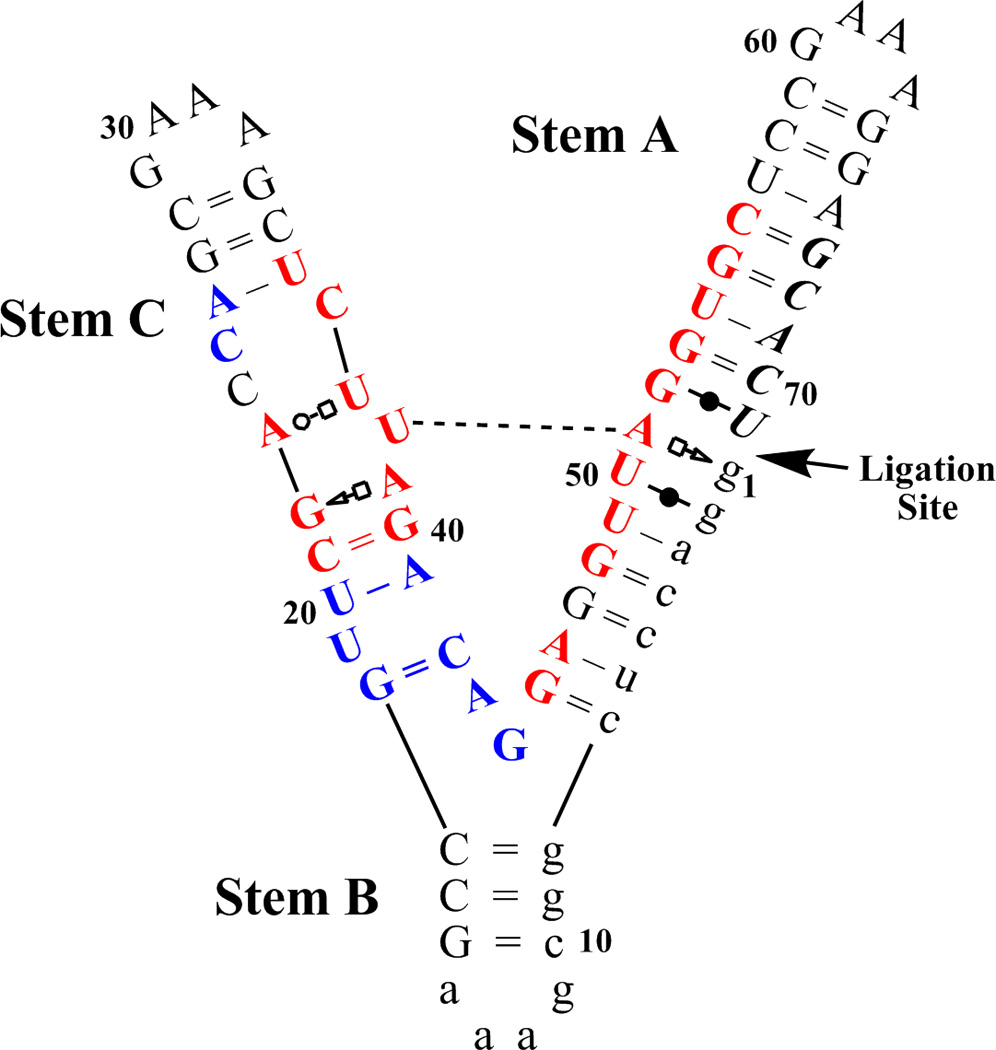
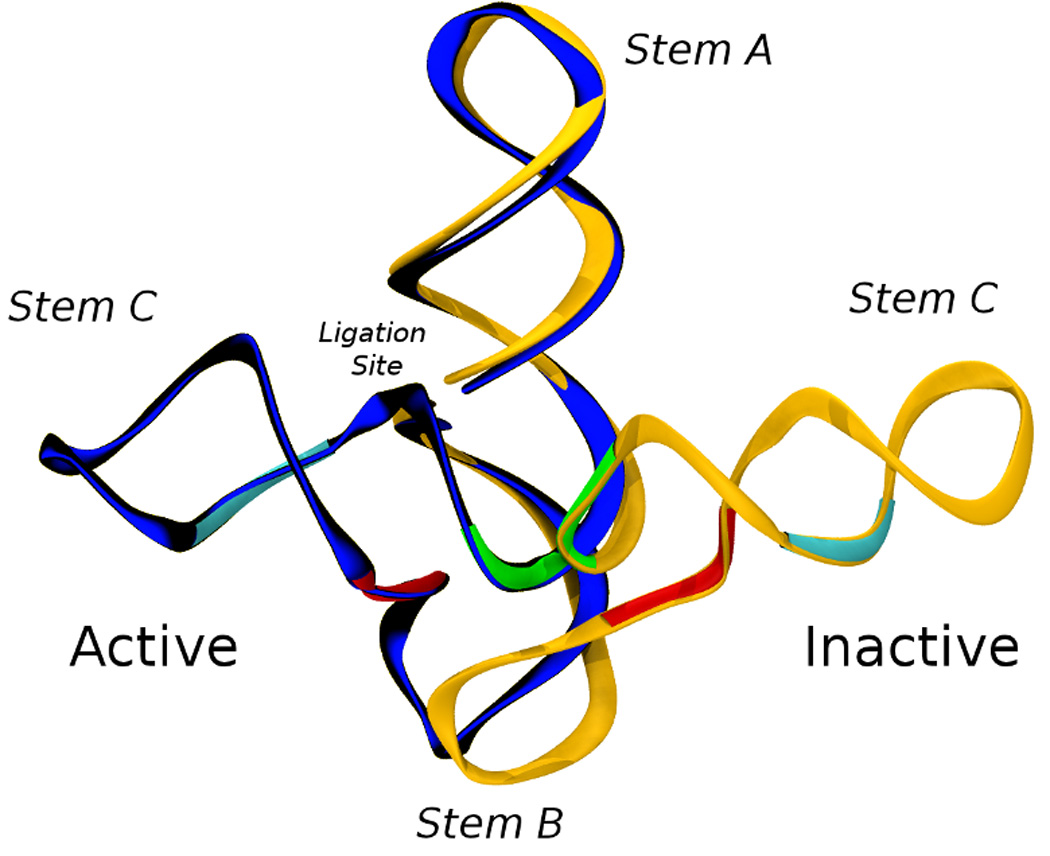
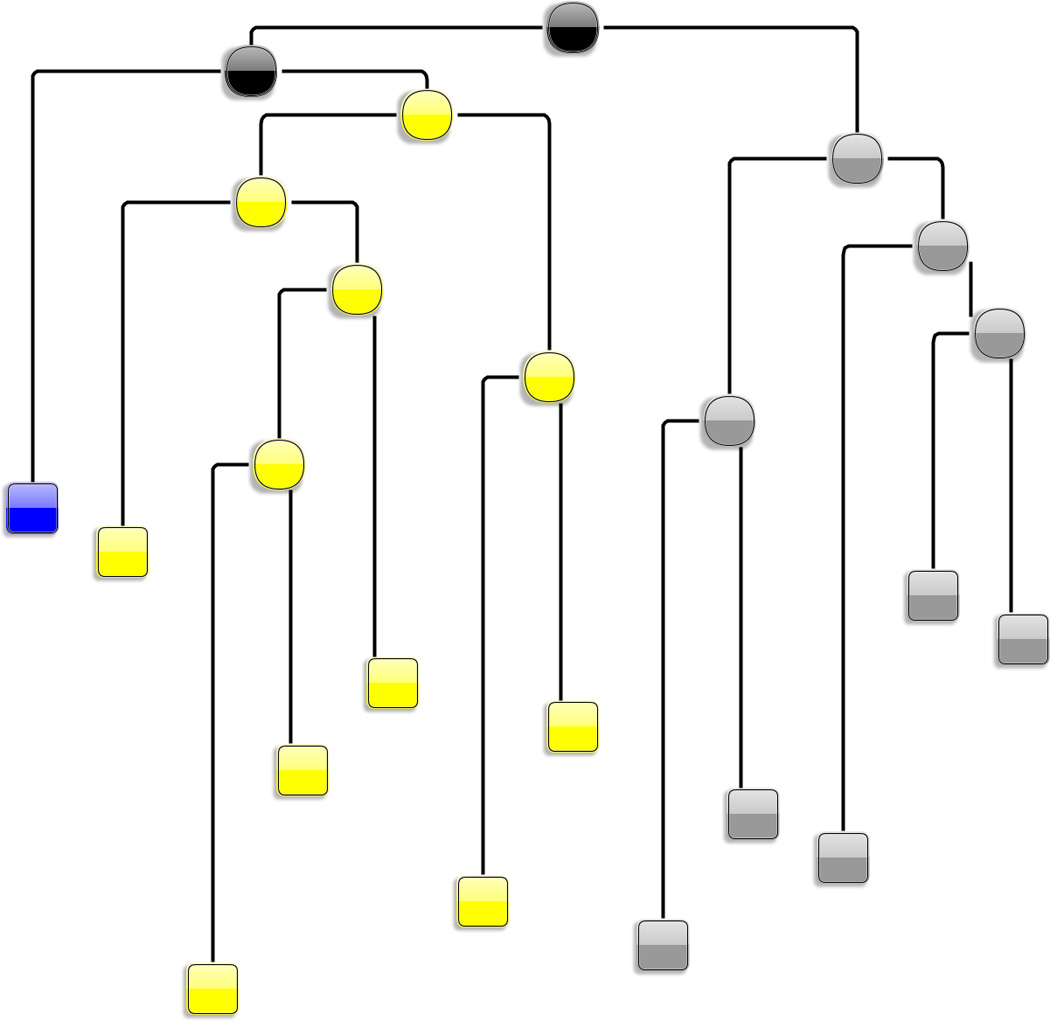
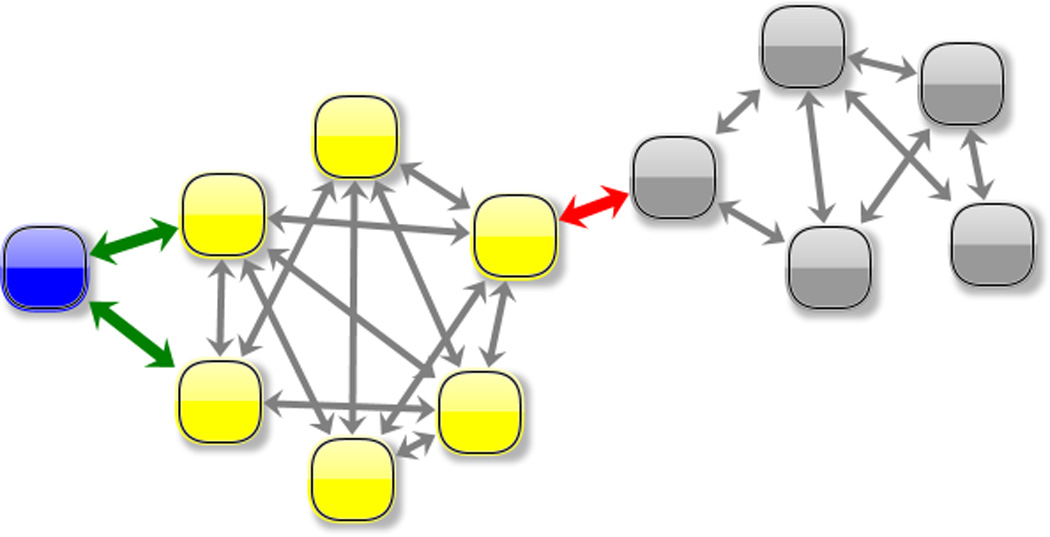
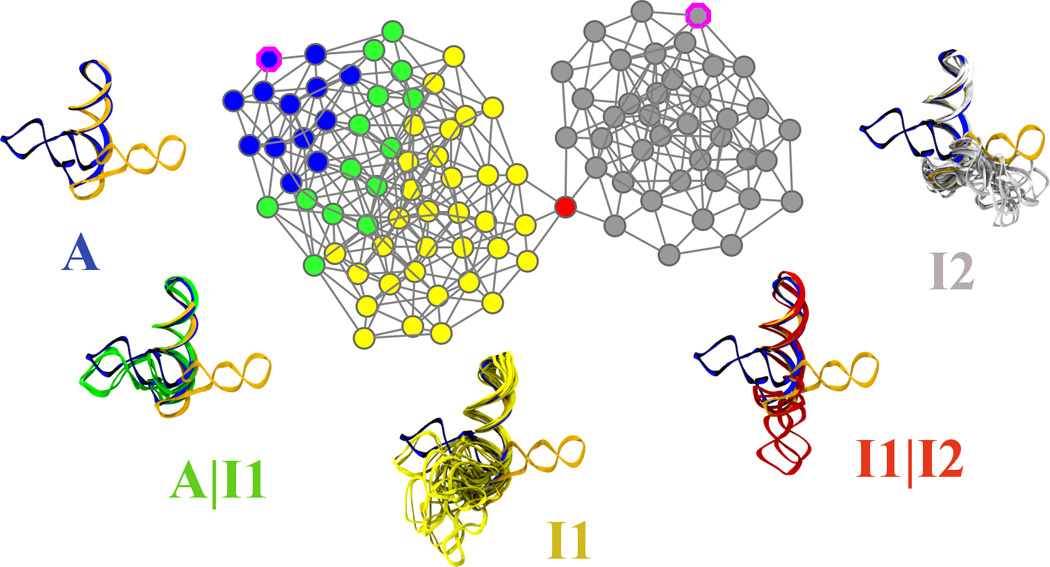
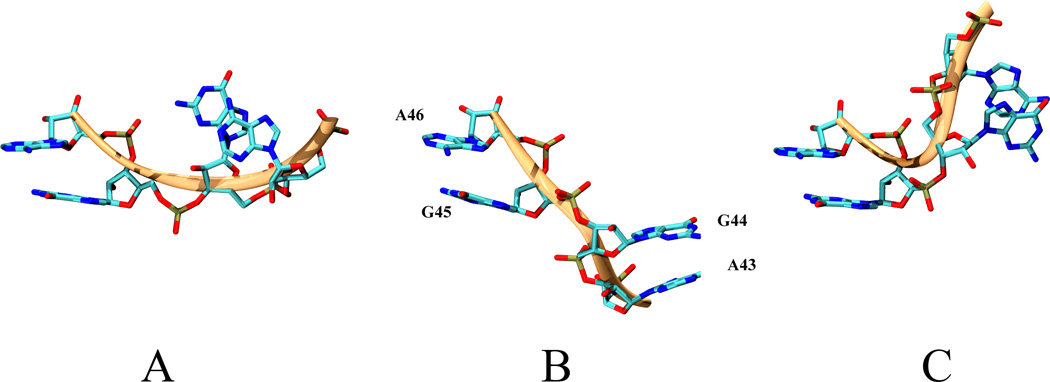
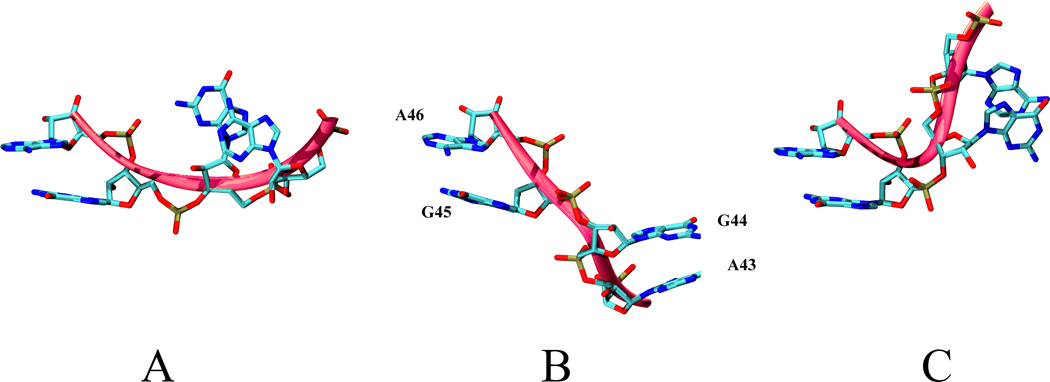
L1 ligase (L1L) molecular switch is an in vitro optimized synthetic allosteric ribozyme that catalyzes the regioselective formation of a 5'-to-3' phosphodiester bond, a reaction for which there is no known naturally occurring RNA catalyst. L1L serves as a proof of principle that RNA can catalyze a critical reaction for prebiotic RNA self-replication according to the RNA world hypothesis. L1L crystal structure captures two distinct conformations that differ by a reorientation of one of the stems by around 80Å and are presumed to correspond to the active and inactive state, respectively. It is of great interest to understand the nature of these two states in solution and the pathway for their interconversion. In this study, we use explicit solvent molecular simulation together with a novel enhanced sampling method that utilizes concepts from network theory to map out the conformational transition between active and inactive states of L1L. We find that the overall switching mechanism can be described as a three-state/two-step process. The first step involves a large-amplitude swing that reorients stem C. The second step involves the allosteric activation of the catalytic site through distant contacts with stem C. Using a conformational space network representation of the L1L switch transition, it is shown that the connection between the three states follows different topographical patterns: the stem C swing step passes through a narrow region of the conformational space network, whereas the allosteric activation step covers a much wider region and a more diverse set of pathways through the network.


Figures

Figure 1
Figure 1
L1L structure. (a) L1L is a γ-shaped molecule, with three stems (labeled A,B,C) joined in a three-way junction. The structure of the stems is mainly helical, with the exception of a bulged loop located on stem C and with GAAA tetra-loops ending each stem. L1L helical parts contain canonical base pairs with the notable exception of 3 consecutive non-canonical base pairs between the active site and the substrate on stem A. The docked/active conformation contains an additional tertiary contact between stem A and stem C (dashed line) mediated by a U38-A51 canonical base pair and a Mg2+ ion. Evolutionarily conserved regions are colored in red for more than 95% and blue for more than 80%. Lower case nucleotides were not varied during the in vitro evolution. The nucleotides that constitute the substrate are in italics[–101, 104, 105]. The L1L construct studied here (l1xc6) has the substrate covalently bound. See text for a more detailed description of the L1L allosterically controlled catalytic mechanism. (b) Overlay of the two crystallized conformations of L1L. Active/docked state is in blue and inactive/undocked state is in orange. The two co-crystallized structures are RMS-fit using all the heavy atoms comprising stem A and B. This shows that for the two structures to interconvert the tip of stem C has to travel over a 80 A long path. We have previously shown[48] that only restricted regions of the L1L structure have to change to assist L1L conformational transition. These restricted regions can be identified using virtual torsions analysis of the crystal structures and molecular dynamics simulations and are marked in green (θ44), red (θ18) and magenta (η37, θ38).
Figure 1
Figure 1
L1L structure. (a) L1L is a γ-shaped molecule, with three stems (labeled A,B,C) joined in a three-way junction. The structure of the stems is mainly helical, with the exception of a bulged loop located on stem C and with GAAA tetra-loops ending each stem. L1L helical parts contain canonical base pairs with the notable exception of 3 consecutive non-canonical base pairs between the active site and the substrate on stem A. The docked/active conformation contains an additional tertiary contact between stem A and stem C (dashed line) mediated by a U38-A51 canonical base pair and a Mg2+ ion. Evolutionarily conserved regions are colored in red for more than 95% and blue for more than 80%. Lower case nucleotides were not varied during the in vitro evolution. The nucleotides that constitute the substrate are in italics[–101, 104, 105]. The L1L construct studied here (l1xc6) has the substrate covalently bound. See text for a more detailed description of the L1L allosterically controlled catalytic mechanism. (b) Overlay of the two crystallized conformations of L1L. Active/docked state is in blue and inactive/undocked state is in orange. The two co-crystallized structures are RMS-fit using all the heavy atoms comprising stem A and B. This shows that for the two structures to interconvert the tip of stem C has to travel over a 80 A long path. We have previously shown[48] that only restricted regions of the L1L structure have to change to assist L1L conformational transition. These restricted regions can be identified using virtual torsions analysis of the crystal structures and molecular dynamics simulations and are marked in green (θ44), red (θ18) and magenta (η37, θ38).
Figure 2
Figure 2
Identification of the main substates spanned during L1L switching is realized in two steps. In the first step, the purpose is to form a minimum number of clusters that capture essential, structurally distinct states. For that a hybrid clustering scheme that chooses the best number of clusters when the sampled active-docked conformations reside in a single cluster. The hybrid clustering consists of a partitional (“top-down”) followed by a agglomerative (“bottom-up”) stage (see Methods) and can be depicted as a dendrogram, (shown in Supplementary Material). Here (2a), a simplified version of the dendrogram is shown whose leaf nodes (i.e. the nodes at the bottom of the dendrogramand shown as squares) are the 12 clusters that were formed right before all the active-docked conformations were agglomerated into a single cluster. The nodes of the dendogram are placed on the vertical following their discovery order. The simplified dendrogram corresponds to the latest steps of the agglomerative (“bottom-up”) stage of the hybrid clustering procedure. In a second step (2b), a conformational space network (CSN) obtained from the the 12 leaves of the hierarchical tree. CSN’s reveal the topography of the conformational space and free energy landscape: it has been shown that it is likely that nodes in the same free energy basin (substate) are well connected among each other, whereas nodes in different basins (substates) are loosely connected[18]. Based on the connectivity pattern, three major substates (labeled A - “active substate” - blue , I1- “inactive substate 1” - yellow, I2 - “inactive substate 2“ - gray) can be identified/isolated. The links of the graph that correspond to the transitions between these three states are colored in green and red respectively. The partitioning into the three sub-states is supported also by structural similarity. Indeed, merging of these three states (shown as black clusters on the dendrogram) occurs at the latest stages of the clustering scheme.
Figure 2
Figure 2
Identification of the main substates spanned during L1L switching is realized in two steps. In the first step, the purpose is to form a minimum number of clusters that capture essential, structurally distinct states. For that a hybrid clustering scheme that chooses the best number of clusters when the sampled active-docked conformations reside in a single cluster. The hybrid clustering consists of a partitional (“top-down”) followed by a agglomerative (“bottom-up”) stage (see Methods) and can be depicted as a dendrogram, (shown in Supplementary Material). Here (2a), a simplified version of the dendrogram is shown whose leaf nodes (i.e. the nodes at the bottom of the dendrogramand shown as squares) are the 12 clusters that were formed right before all the active-docked conformations were agglomerated into a single cluster. The nodes of the dendogram are placed on the vertical following their discovery order. The simplified dendrogram corresponds to the latest steps of the agglomerative (“bottom-up”) stage of the hybrid clustering procedure. In a second step (2b), a conformational space network (CSN) obtained from the the 12 leaves of the hierarchical tree. CSN’s reveal the topography of the conformational space and free energy landscape: it has been shown that it is likely that nodes in the same free energy basin (substate) are well connected among each other, whereas nodes in different basins (substates) are loosely connected[18]. Based on the connectivity pattern, three major substates (labeled A - “active substate” - blue , I1- “inactive substate 1” - yellow, I2 - “inactive substate 2“ - gray) can be identified/isolated. The links of the graph that correspond to the transitions between these three states are colored in green and red respectively. The partitioning into the three sub-states is supported also by structural similarity. Indeed, merging of these three states (shown as black clusters on the dendrogram) occurs at the latest stages of the clustering scheme.
Figure 3
Figure 3
Mapping the L1L switching mechanism using a conformational space network. A conformational space network (CSN) is a graph whose nodes (shown here as circles) are conformations and linkages ( or edges, shown here as lines connecting the circles) represent transitions between them. These transitions are observed during MD simulations. CSN’s are a discrete representation of the states as well as the paths that connect them and can reveal the topography of the conformational space. It is likely that nodes in the same free energy basin are well connected among each other, whereas nodes in different basins are loosely connected[18]. Additionally, finding the nodes that allow two sub-states to connect can reveal the required structural features of that transition to occur. Here we use a CSN built using 100 conformations obtained using a partitional clustering technique described in Materials and Methods. The nodes of the network are colored based on their inclusion into the three main identified substates (A - blue, I1 - yellow or I2 - gray) or at the boundaries (interfaces) between the substates (A|I1 interface - green or I1|I2 interface - red). Clusters belonging to the A and I2 states that contain the two crystallized constructs are marked with a magenta border. Representative sets structures for each of the substates and their corresponding interfaces are shown. For reference all the sets are superimposed on the crystallized conformations, shown here in blue (active) and gray (inactive). All structures are rms-fit using all heavy atoms comprising stems A and B. We find that the overall switching mechanism can be described as a 3-state/2-step process. It is interesting to note that the connection between the three states follows different topographical patterns: the stem C swing (I1⇌I2) step passes through a narrow region of the conformational space network, whereas the allosteric activation step (A⇌I1) covers a much wider region and a more diverse set of pathways through the network.
Figure 4
Figure 4
The dynamical signature of the active site changes when transitioning between active (A) to the inactive state (I1). (Top) After removing the contacts between U38 and the active site, the latter recovers the dynamical signature of the inactive /undocked states. (4a)This change is followed in terms of the time series of three important hydrogen bonding distances that are characteristic to a complete A51 □→ G1 (trans-Hoogsteen/sugar edge base pair) specific to the inactive state. On the left the multimodal distribution of these three hydrogen bonding distances specific to the active /docked conformation simulations both in the product as well as in the precursor state. On the right, the same distributions, that are now unimodal in nature, obtained during the molecular dynamics simulations of the inactive/undocked conformer simulations. In the middle the time series evolution of the hydrogen bonding distances, after the unfolding/undocking biasing potential has been removed. It is important to note that the docked and undocked conformer simulation results shown here come from separate unbiased simulations. (Bottom)Three representative snapshots along the unfolding /undocking trajectory. (A, B) Structures that are representative for the active conformation and are the two major conformations identified also in the active precursor simulation [48]. For these two structures G1:O2’ does not make a hydrogen bond with A51:N6, typical for a complete A51 G1. (C) Structure representative for the undocked/inactive conformation, yielding a complete A51 □→ G1 base pair.
Figure 4
Figure 4
The dynamical signature of the active site changes when transitioning between active (A) to the inactive state (I1). (Top) After removing the contacts between U38 and the active site, the latter recovers the dynamical signature of the inactive /undocked states. (4a)This change is followed in terms of the time series of three important hydrogen bonding distances that are characteristic to a complete A51 □→ G1 (trans-Hoogsteen/sugar edge base pair) specific to the inactive state. On the left the multimodal distribution of these three hydrogen bonding distances specific to the active /docked conformation simulations both in the product as well as in the precursor state. On the right, the same distributions, that are now unimodal in nature, obtained during the molecular dynamics simulations of the inactive/undocked conformer simulations. In the middle the time series evolution of the hydrogen bonding distances, after the unfolding/undocking biasing potential has been removed. It is important to note that the docked and undocked conformer simulation results shown here come from separate unbiased simulations. (Bottom)Three representative snapshots along the unfolding /undocking trajectory. (A, B) Structures that are representative for the active conformation and are the two major conformations identified also in the active precursor simulation [48]. For these two structures G1:O2’ does not make a hydrogen bond with A51:N6, typical for a complete A51 G1. (C) Structure representative for the undocked/inactive conformation, yielding a complete A51 □→ G1 base pair.
Figure 5
Figure 5
The transition between I1 and I2 substates is supported by θ44 virtual torsion (A43-G44-G45-A46). (5a) The distribution of θ44 in the vicinity of the the I1 – I2 interface node shows that θ44 has to traverse the - 10 to 0 degree interval to allow the transition from I1 to I2. The UN-normalized distributions of θ44 for two sets of nodes of the CSN shown in are shown. The depth1 set includes all the nodes that are at 1 edge distance from the interface node. The depth 2 set includes all the nodes that are a distance of 2 edges or less from the interface node. (5b)Representative conformations of the region spanned by θ44 of the three-way junction along the conformational switch pathway. A) conformation specific to the vicinity of the active conformation, B) conformation located on the -10:0 interval of θ44, C) conformation specific to the vicinity of the crystallized active conformation. The backbone is shown in green and corresponds to the region spanned by θ44 on L1L backbone in Fig. 1.
Figure 5
Figure 5
The transition between I1 and I2 substates is supported by θ44 virtual torsion (A43-G44-G45-A46). (5a) The distribution of θ44 in the vicinity of the the I1 – I2 interface node shows that θ44 has to traverse the - 10 to 0 degree interval to allow the transition from I1 to I2. The UN-normalized distributions of θ44 for two sets of nodes of the CSN shown in are shown. The depth1 set includes all the nodes that are at 1 edge distance from the interface node. The depth 2 set includes all the nodes that are a distance of 2 edges or less from the interface node. (5b)Representative conformations of the region spanned by θ44 of the three-way junction along the conformational switch pathway. A) conformation specific to the vicinity of the active conformation, B) conformation located on the -10:0 interval of θ44, C) conformation specific to the vicinity of the crystallized active conformation. The backbone is shown in green and corresponds to the region spanned by θ44 on L1L backbone in Fig. 1.
Figure 6
Figure 6
To focus the sampling around relatively unexplored/under–sampled regions of the conformational space that might reside along the L1L switching pathway we designed an iterative strategy (FSN – Focused Sampling on Networks). The projection of the structures on a set of order parameters (6a) is clustered using an incremental partitional 300-way clustering technique (see Materials and Methods). Data points belonging to the same cluster have the same color. A network is built so that each one of the previously determined clusters is assimilated with a node (6b). Each node being connected to its closest 8 neighbors using a cosine similarity/distance-based function(6c). For each of the clusters a sampling density is calculated that is displayed here using red-blue color map, the red corresponding to low densities whereas the blue corresponds to the high densities(6d). Each of the network nodes is associated a traversal count, i.e. number of times it is crossed by all the shortest paths along the graph between all the nodes of the graph (6e). A similar red-blue color map is used here, with red corresponding to lower values and blue corresponding to a higher values of the traversal counts. The swarm of trajectories launching points (here colored in green) are chosen as the nodes that have a low sampling density and have a high traversal counts (6f).

Similar articles

Cited by

References

    1. Al-Hashimi HM, Walter NG. RNA dynamics: it is about time. Curr. Opin. Struct. Biol. 2008 Jun;18(3):321–329. - PMC - PubMed
    1. Allen M, Tildesley D. Computer Simulation of Liquids. Oxford: Oxford University Press; 1987.
    1. Bagby SC, Bergman NH, Shechner DM, Yen C, Bartel DP. A class I ligase ribozyme with reduced Mg2+ dependence: Selection, sequence analysis, and identification of functional tertiary interactions. RNA. 2009;15:2129–2146. - PMC - PubMed
    1. Bailor MH, Mustoe AM, Brooks CL, Al-Hashimi HM. Topological constraints: using RNA secondary structure to model 3D conformation, folding pathways, and dynamic adaptation. Curr. Opin. Struct. Biol. 2011 Jun;21(3):296–305. - PMC - PubMed
    1. Bailor MH, Sun X, Al-Hashimi HM. Topology links RNA secondary structure with global conformation, dynamics, and adaptation. Science. 2010 Jan;327(5962):202–206. - PubMed

Publication types

LinkOut - more resources