. 2012 Aug;63(13):4821-33.
doi: 10.1093/jxb/ers153. Epub 2012 Jul 5.

A peroxisomally localized acyl-activating enzyme is required for volatile benzenoid formation in a Petuniaxhybrida cv. 'Mitchell Diploid' flower

Affiliations

A peroxisomally localized acyl-activating enzyme is required for volatile benzenoid formation in a Petuniaxhybrida cv. 'Mitchell Diploid' flower

Thomas A Colquhoun et al. J Exp Bot. 2012 Aug.

Abstract

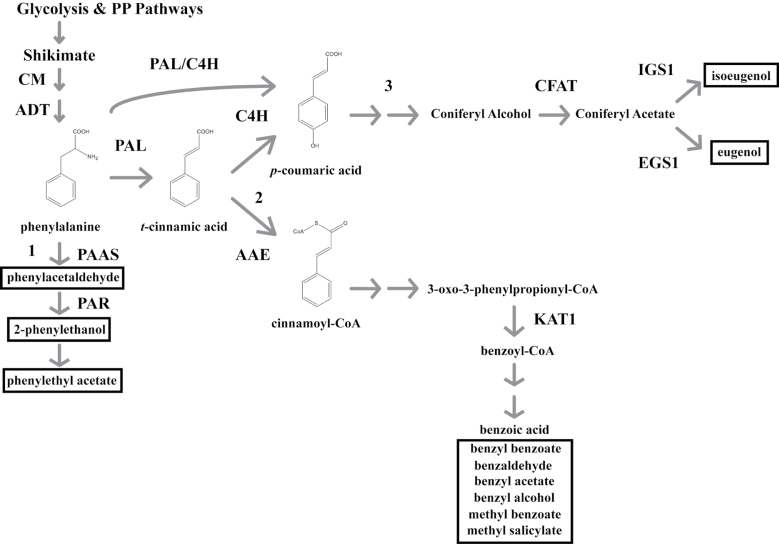
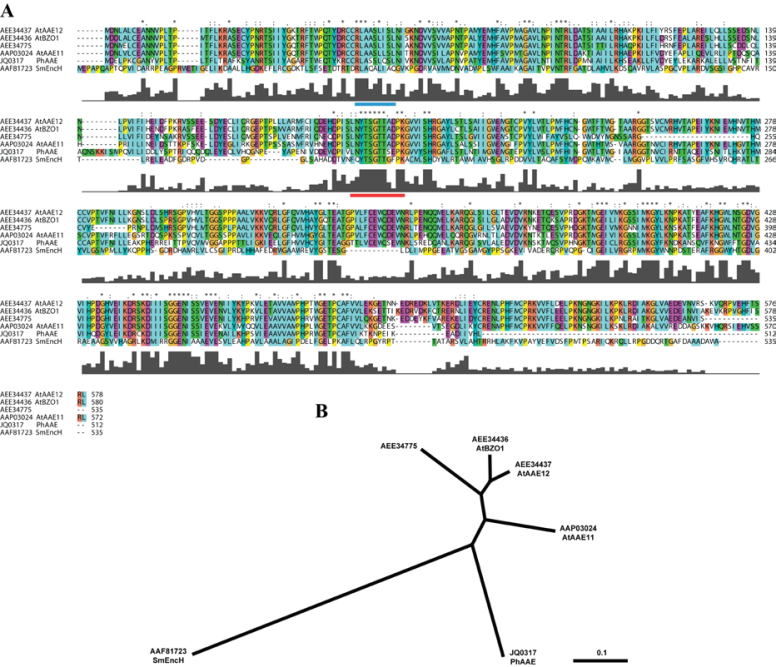
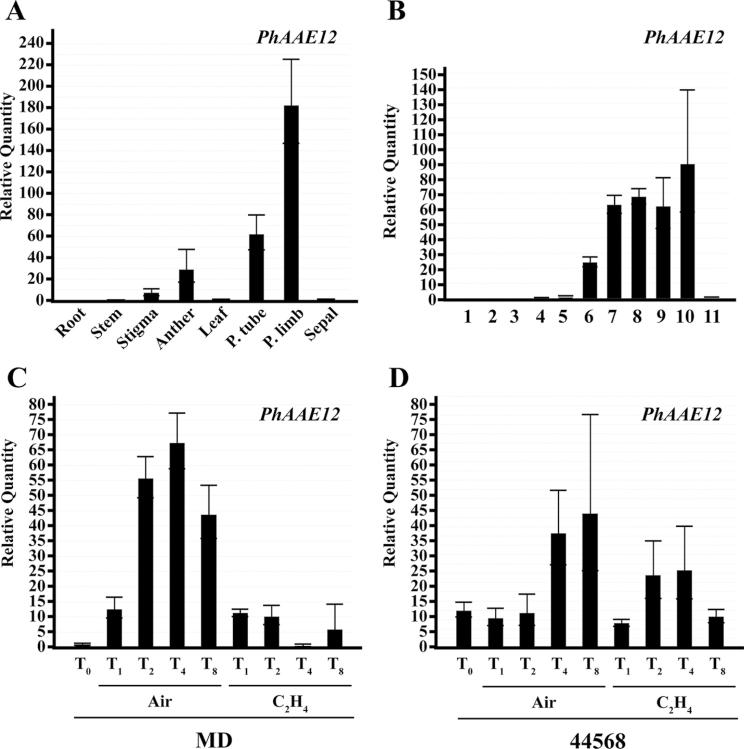
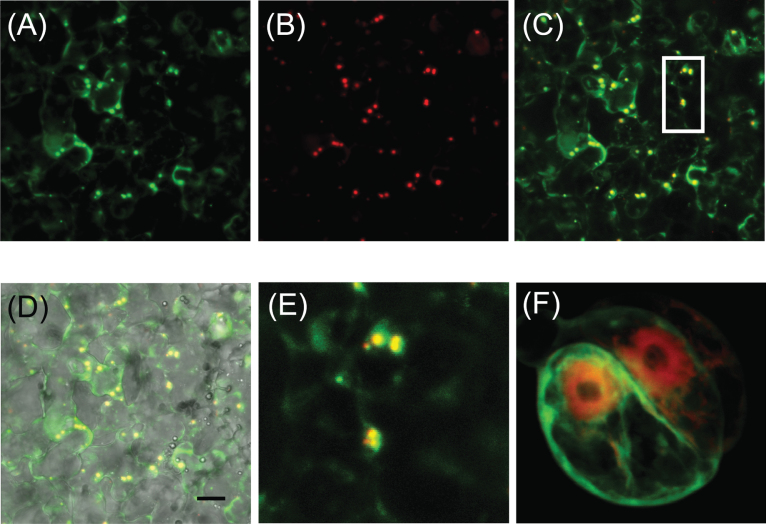
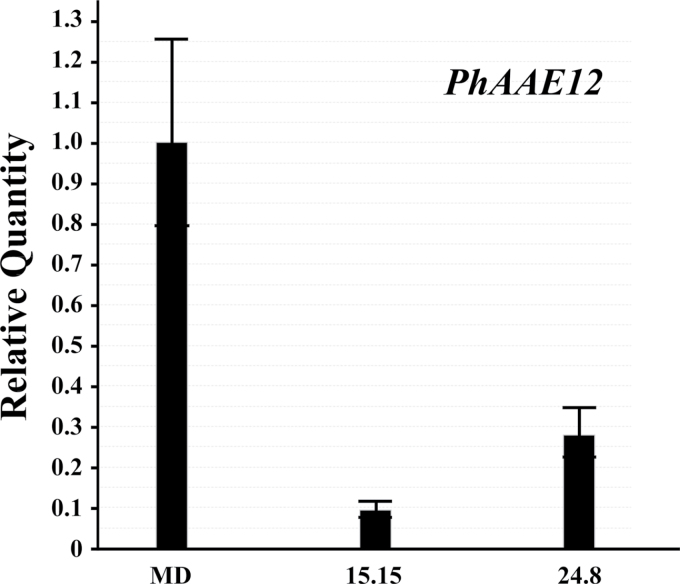
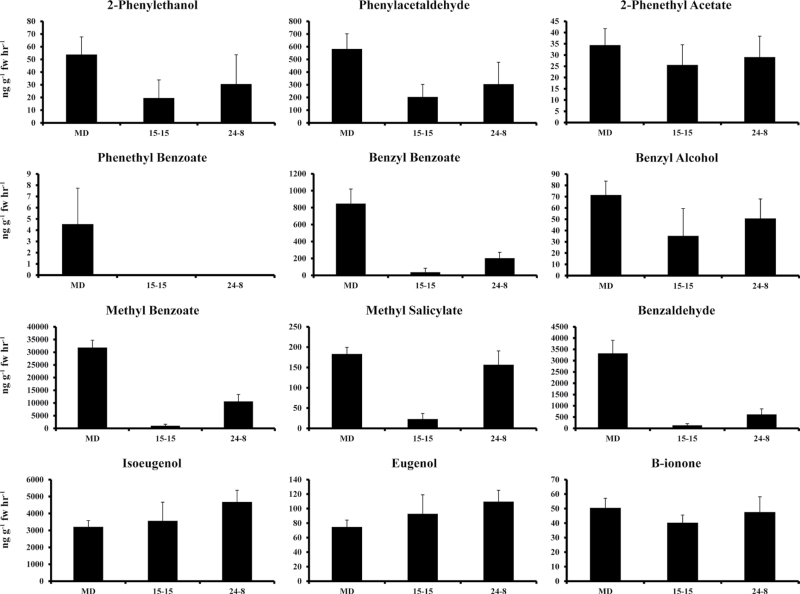
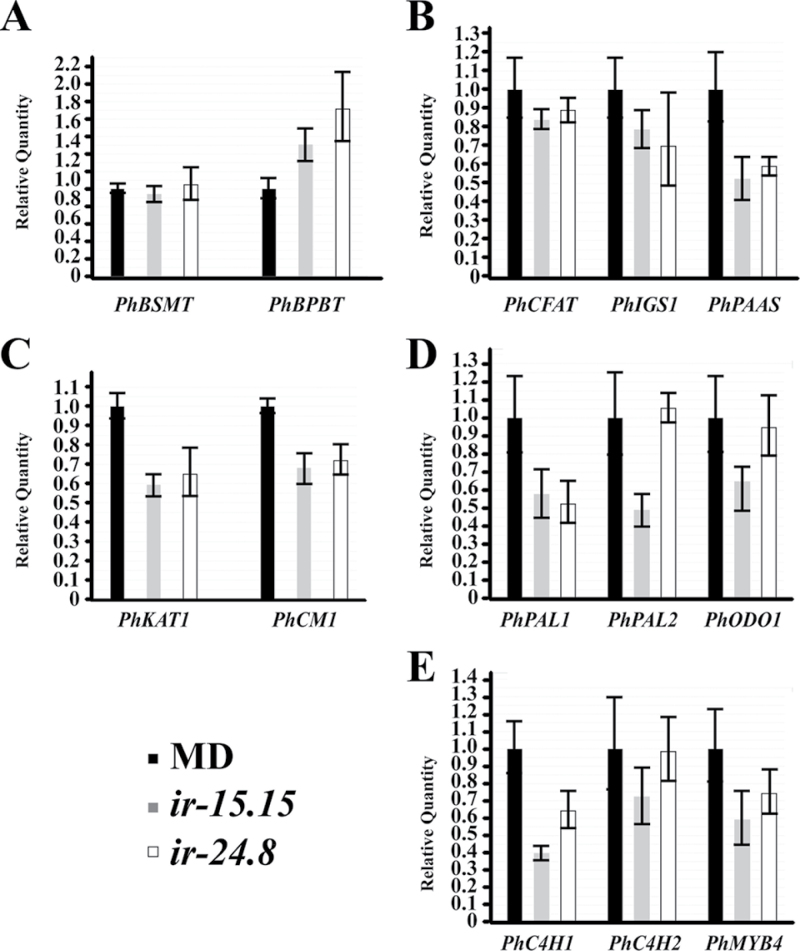
Floral volatile benzenoid/phenylpropanoid (FVBP) biosynthesis is a complex and coordinate cellular process executed by petal limb cells of a Petunia×hybrida cv. 'Mitchell Diploid' (MD) plant. In MD flowers, the majority of benzenoid volatile compounds are derived from a core phenylpropanoid pathway intermediate by a coenzyme A (CoA) dependent, β-oxidative scheme. Metabolic flux analysis, reverse genetics, and biochemical characterizations of key enzymes in this pathway have supported this putative concept. However, the theoretical first enzymatic reaction, which leads to the production of cinnamoyl-CoA, has only been physically demonstrated in a select number of bacteria like Streptomyces maritimus through mutagenesis and recombinant protein production. A transcript has been cloned and characterized from MD flowers that shares high homology with an Arabidopsis thaliana transcript ACYL-ACTIVATING ENZYME11 (AtAAE11) and the S. maritimus ACYL-COA:LIGASE (SmEncH). In MD, the PhAAE transcript accumulates in a very similar manner as bona fide FVBP network genes, i.e. high levels in an open flower petal and ethylene regulated. In planta, PhAAE is localized to the peroxisome. Upon reduction of PhAAE transcript through a stable RNAi approach, transgenic flowers emitted a reduced level of all benzenoid volatile compounds. Together, the data suggest that PhAAE may be responsible for the activation of t-cinnamic acid, which would be required for floral volatile benzenoid production in MD.


Figures

Fig. 1.
Fig. 1.
A schematic representation of the FVBP pathway in MD. Glycolysis and the pentose phosphate (PP) pathways provide the initial carbon substrates (phosphoenolpyruvate and erythrose-4-phosphate, respectively) for the condensation to a benzene ringed structure through the shikimate pathway. The aromatic amino acid phenylalanine is generated by a succession of two plastid enzymes (CHORISMATE MUTASE, CM; AROGENATE DEHYDRATASE, ADT). PHENYLALANINE AMMONIA-LYASE (PAL) converts phenylalanine to t-cinnamic acid, or PAL can associate with CINNAMTE-4-HYDROXYLASE (C4H) ultimately to form p-coumaric acid. Floral volatile benzenoid\phenylpropanoid (FVBP) metabolic branch 1 emanates from phenylalanine with the PHENYLACETALDEHYDE SYNTHASE (PAAS) enzyme, branch 2 by way of t-cinnamic acid through ACYL-ACTIVATING ENZYME (AAE), and branch 3 from p-coumaric acid. All FVBP compounds are boxed with a black line. Enzymes also depicted: PHENYLACETALDEHYDE REDUCTASE (PAR), CONIFERYL ALCOHOL ACYLTRANSFERASE (CFAT), ISOEUGENOL SYNTHASE 1 (IGS1), EUGENOL SYNTHASE1 (EGS1), and 3-KETOACYL-COA THIOLASE (KAT1).
Fig. 2.
Fig. 2.
Predicted amino acid sequence alignment and phylogenetic tree. Sequences represented are from Streptomyces maritimus, Arabidopsis thaliana, and Petunia×hybrida. Sequences were aligned using MULTIPLE ALIGNMENT MODE of ClustalX 2.0 program software (Larkin et al., 2007). Above the sequence alignment ‘*’ indicates a fully conserved residue, ‘:’ indicates a fully conserved ‘strong’ group, and ‘.’ indicates a fully conserved ‘weak’ group. Colours are assigned to groups of amino acids as follows: orange for G, P, S, and T; red for H, K, and R; blue for F, W, and Y; and green for I, L, M, and V. Predicted PTS2 (Do-It-Yourself Block Search http://www.peroxisomedb.org/diy_PTS1.html) is represented by a blue bar below residues 51–59 of PhAAE, while the conserved AMP-binding site (InterProScan, http://www.ebi.ac.uk/Tools/pfa/iprscan/) is represented by a red bar below residues 197–208 of PhAAE (A). The Neighbor–Joining tree was derived by ClustalX and visualized in TreeView 1.6.6 as an unrooted tree (B).
Fig. 3.
Fig. 3.
PhAAE transcript accumulation analysis (one-step qRT-PCR). Spatial analysis used root, stem, stigma, anther, leaf, petal tube, petal limb, and sepal tissues of MD harvested at 16.00h (A). Floral developmental analysis used MD flowers from 11 sequential stages collected on one day at 16.00h (B). Ethylene treatment (2 µl l–1 analysis used excised MD and 44 568 whole flowers treated for 0, 1, 2, 4, and 8h (C, D). 50ng total RNA was used per reaction in all cases. Histograms are representative of multiple experiments and multiple biological replicates, and analyzed by the ∆∆Ct method with PhFBP1 and Ph18S as the internal references (mean±SE; n=3).
Fig. 4.
Fig. 4.
In vivo subcellular localization of PhAAE in MD petals and Arabidopsis protoplasts. (A) 35S:PhAAE-GFP and (B) the mCherry peroxisomal marker px-rk (Nelson et al., 2007) were co-infiltrated using A. tumefaciens in MD petal tissue. (C) The merged image of(A) and (B). (D) A merge of (C) and a brightfield image. (E) Magnification of the boxed area in (C). (F) Co-expression of a 35S:mCherry and 35S:PhAAE:GFP in Arabidopsis protoplasts. Representative images are shown. The scale bar in (D) represents 10 µm.
Fig. 5.
Fig. 5.
PhAAE comparative transcript accumulation analysis between MD and two independent, homozygous T2 ir-PhAAE lines (15.15 and 24.8). 50ng total RNA was used per reaction in all cases for one-step qRT-PCR with RNA isolated from stage 8 flowers at 16.00h. Histograms are representative of multiple experiments and multiple biological replicates, and analyzed by the ∆∆Ct method with PhFBP1 and Ph18S as the internal references. The individual petunia transcript analyzed is PhAAE (mean±SE; n=3).
Fig. 6.
Fig. 6.
FVBP emission analysis of representative plants from two independent, homozygous T2 ir-PhAAE lines (15.15 and 24.8) and MD. Developmentally staged flowers (stage 8) were used to collect FVBP emission at 18:00h (mean±SE; n=3). Twelve major FVBP compounds were identified and quantified with all measurements ng g–1 FW h–1.
Fig. 7.
Fig. 7.
PhAAE comparative transcript accumulation analysis between MD and two independent, homozygous T2 ir-PhAAE lines (15.15 and 24.8). 50ng total RNA was used per reaction in all cases for one-step qRT-PCR with RNA isolated from stage 8 flowers at 16.00h. Histograms are representative of multiple experiments and multiple biological replicates, and analyzed by the ∆∆Ct method with PhFBP1 and Ph18S as the internal references. The individual petunia transcripts analyzed are PhBSMT, PhBPBT, PhCFAT, PhIGS1, PhPAAS, PhKAT1, PhCM1, PhPAL1, PhPAL2, PhODO1, PhC4H1, PhC4H2, and PhMYB4 (mean±SE; n=3).

Similar articles

Cited by

References

    1. Achnine L, Blancaflor EB, Rasmussen S, Dixon RA. Colocalization of L-phenylalanine ammonia-lyase and cinnamate 4-hydroxylase for metabolic channeling in phenylpropanoid biosynthesis. The Plant Cell. 2004;16:3098–3109. - PMC - PubMed
    1. Anterola AM, Jeon JH, Davin LB, Lewis NG. Transcriptional control of monolignol biosynthesis in Pinus taeda: factors affecting monolignol ratios and carbon allocation in phenylpropanoid metabolism. Journal of Biological Chemistry. 2002;277:18272–18280. - PubMed
    1. Beuerle T, Pichersky E. Purification and characterization of benzoate:coenzyme A ligase from Clarkia breweri . Archives of Biochemistry and Biochemistry. 2002;400:258–264. - PubMed
    1. Blount JW, Korth KL, Masoud SA, Rasmussen S, Lamb C, Dixon RA. Altering expression of cinnamic acid 4-hydroxylase in transgenic plants provides evidence for a feedback loop at the entry point into the phenylpropanoid pathway. Plant Physiology. 2000;122:107–116. - PMC - PubMed
    1. Boatright J, Negre F, Chen X, Kish CM, Wood B, Peel G, Orlova I, Gang D, Rhodes D, Dudareva N. Understanding in vivo benzenoid metabolism in petunia petal tissue. Plant Physiology. 2004;135:1993–2011. - PMC - PubMed

Publication types

MeSH terms

Associated data