

Interstitial myocardial fibrosis assessed as extracellular volume fraction with low-radiation-dose cardiac CT
- PMID: 22771879
- PMCID: PMC3426854
- DOI: 10.1148/radiol.12112458
Interstitial myocardial fibrosis assessed as extracellular volume fraction with low-radiation-dose cardiac CT
Abstract
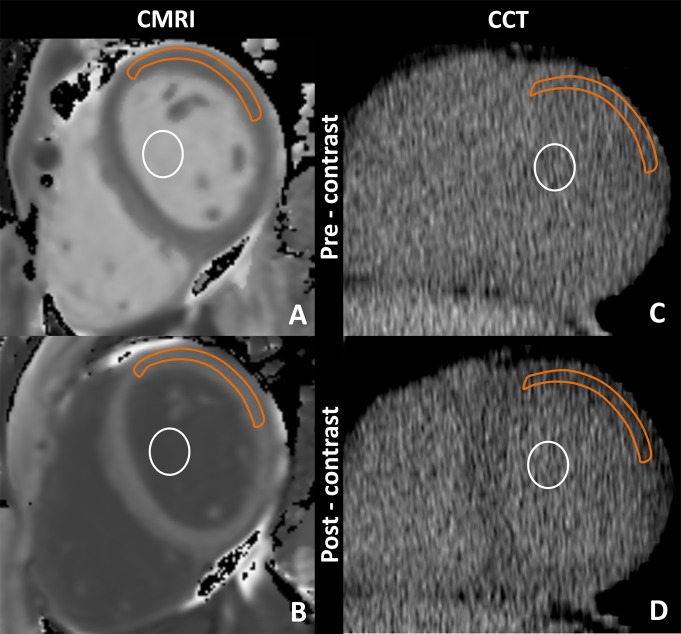
Purpose: To develop a cardiac computed tomographic (CT) method with which to determine extracellular volume (ECV) fraction, with cardiac magnetic resonance (MR) imaging as the reference standard.
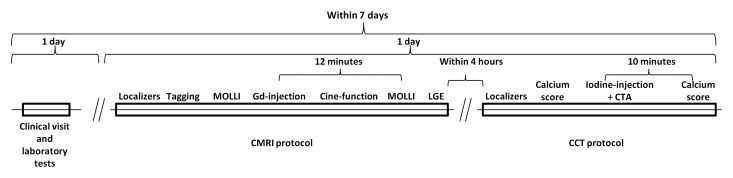
Materials and methods: Study participants provided written informed consent to participate in this institutional review board-approved study. ECV was measured in healthy subjects and patients with heart failure by using cardiac CT and cardiac MR imaging. Paired Student t test, linear regression analysis, and Pearson correlation analysis were used to determine the relationship between cardiac CT and MR imaging ECV values and clinical parameters.
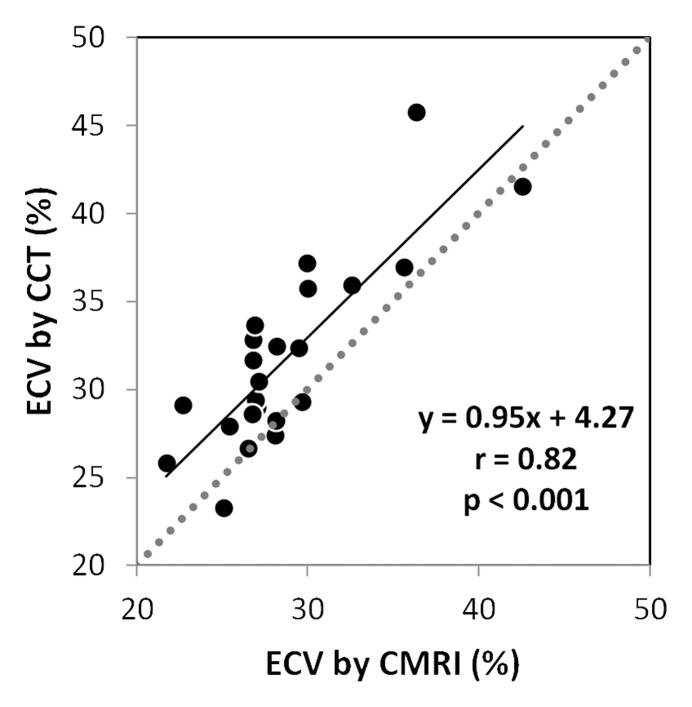
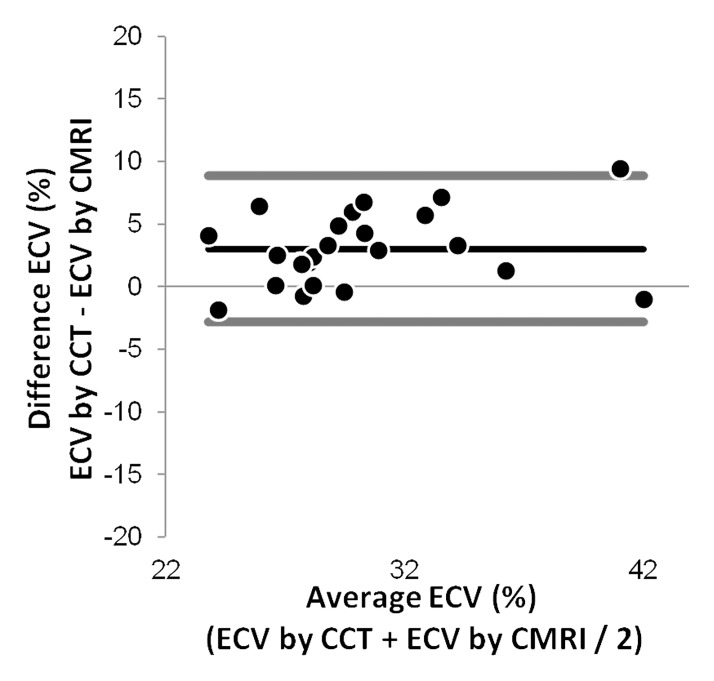
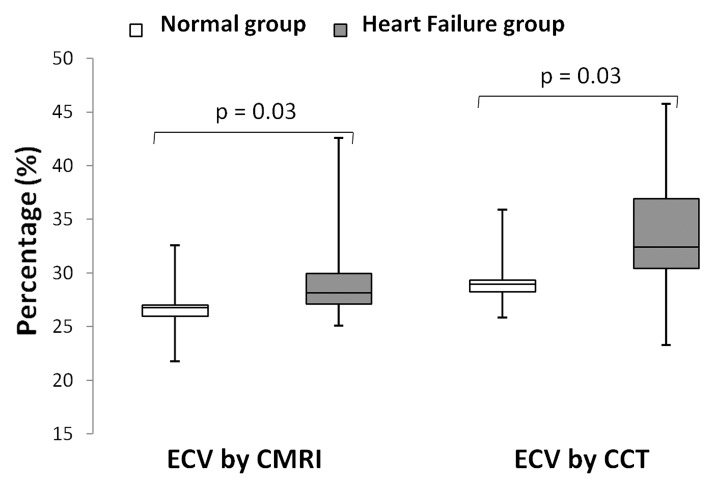
Results: Twenty-four subjects were studied. There was good correlation between myocardial ECV measured at cardiac MR imaging and that measured at cardiac CT (r = 0.82, P < .001). As expected, ECV was higher in patients with heart failure than in healthy control subjects for both cardiac CT and cardiac MR imaging (P = .03, respectively). For both cardiac MR imaging and cardiac CT, ECV was positively associated with end diastolic and end systolic volume and inversely related to ejection fraction (P < .05 for all). Mean radiation dose was 1.98 mSv ± 0.16 (standard deviation) for each cardiac CT acquisition.
Conclusion: ECV at cardiac CT and that at cardiac MR imaging showed good correlation, suggesting the potential for myocardial tissue characterization with cardiac CT.
© RSNA, 2012
Figures
References
-
- Kim RJ, Fieno DS, Parrish TB, et al. Relationship of MRI delayed contrast enhancement to irreversible injury, infarct age, and contractile function. Circulation 1999;100(19):1992–2002 - PubMed
-
- Senra T, Shiozaki AA, Salemi VM, Rochitte CE. Delayed enhancement by multidetector computed tomography in endomyocardial fibrosis. Eur Heart J 2008;29(3):347. - PubMed
-
- Bauer RW, Kerl JM, Fischer N, et al. Dual-energy CT for the assessment of chronic myocardial infarction in patients with chronic coronary artery disease: comparison with 3-T MRI. AJR Am J Roentgenol 2010;195(3):639–646 - PubMed
MeSH terms
Substances
LinkOut - more resources
Full Text Sources
Other Literature Sources
Medical
Research Materials
