

Mapping microvasculature with acoustic angiography yields quantifiable differences between healthy and tumor-bearing tissue volumes in a rodent model
- PMID: 22771882
- PMCID: PMC3426858
- DOI: 10.1148/radiol.12112000
Mapping microvasculature with acoustic angiography yields quantifiable differences between healthy and tumor-bearing tissue volumes in a rodent model
Abstract
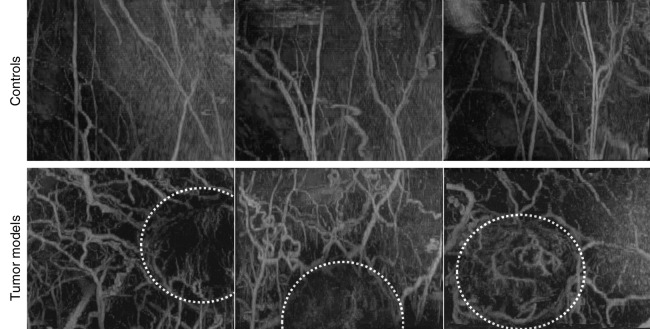
Purpose: To determine if the morphologies of microvessels could be extracted from contrast material-enhanced acoustic angiographic ultrasonographic (US) images and used as a quantitative basis for distinguishing healthy from diseased tissue.
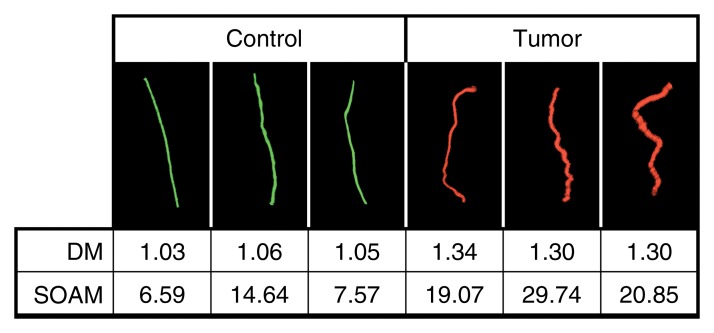
Materials and methods: All studies were institutional animal care and use committee approved. Three-dimensional contrast-enhanced acoustic angiographic images were acquired in both healthy (n = 7) and tumor-bearing (n = 10) rats. High-spatial-resolution and high signal-to-noise acquisition was enabled by using a prototype dual-frequency US transducer (transmit at 4 MHz, receive at 30 MHz). A segmentation algorithm was utilized to extract microvessel structure from image data, and the distance metric (DM) and the sum of angles metric (SOAM), designed to distinguish different types of tortuosity, were applied to image data. The vessel populations extracted from tumor-bearing tissue volumes were compared against vessels extracted from tissue volumes in the same anatomic location within healthy control animals by using the two-sided Student t test.
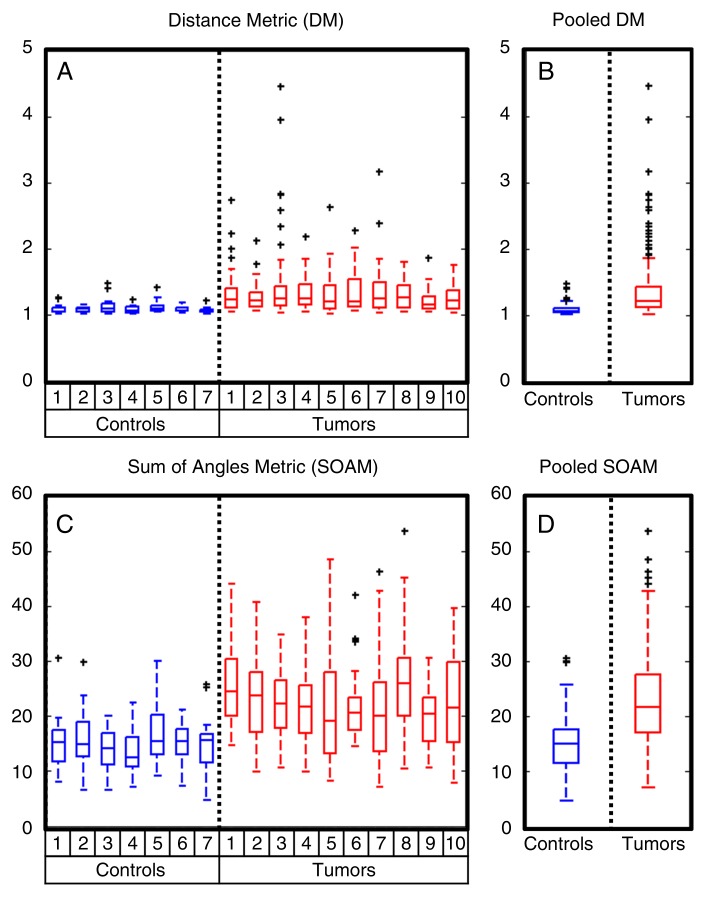
Results: Metrics of microvascular tortuosity were significantly higher in the tumor population. The average DM of the tumor population (1.34 ± 0.40 [standard deviation]) was 23.76% higher than that of the control population (1.08 ± 0.08) (P < .0001), while the average SOAM (22.53 ± 7.82) was 50.73% higher than that of the control population (14.95 ± 4.83) (P < .0001). The DM and SOAM metrics for the control and tumor populations were significantly different when all vessels were pooled between the two animal populations. In addition, each animal in the tumor population had significantly different DM and SOAM metrics relative to the control population (P < .05 for all; P value ranges for DM, 3.89 × 10(-)(7) to 5.63 × 10(-)(3); and those for SOAM, 2.42 × 10(-)(12) to 1.57 × 10(-)(3)).
Conclusion: Vascular network quantification by using high-spatial-resolution acoustic angiographic images is feasible. Data suggest that the angiogenic processes associated with tumor development in the models studied result in higher instances of vessel tortuosity near the tumor site.
© RSNA, 2012
Figures
References
-
- Lindner JR. Microbubbles in medical imaging: current applications and future directions. Nat Rev Drug Discov 2004;3(6):527–532 - PubMed
-
- Wilson SR, Burns PN. Microbubble-enhanced US in body imaging: what role? Radiology 2010;257(1):24–39 - PubMed
-
- Carr CL, Lindner JR. Myocardial perfusion imaging with contrast echocardiography. Curr Cardiol Rep 2008;10(3):233–239 - PubMed
-
- Lindner JR. Molecular imaging of cardiovascular disease with contrast-enhanced ultrasonography. Nat Rev Cardiol 2009;6(7):475–481 - PubMed
Publication types
MeSH terms
Substances
Grants and funding
LinkOut - more resources
Full Text Sources
Other Literature Sources
