. 2013 Sep;23(9):2100-17.
doi: 10.1093/cercor/bhs197. Epub 2012 Jul 6.

Regional infant brain development: an MRI-based morphometric analysis in 3 to 13 month olds

Affiliations

Regional infant brain development: an MRI-based morphometric analysis in 3 to 13 month olds

Myong-Sun Choe et al. Cereb Cortex. 2013 Sep.

Abstract

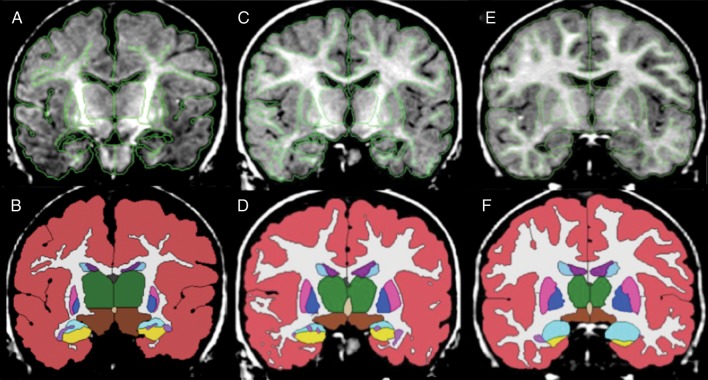
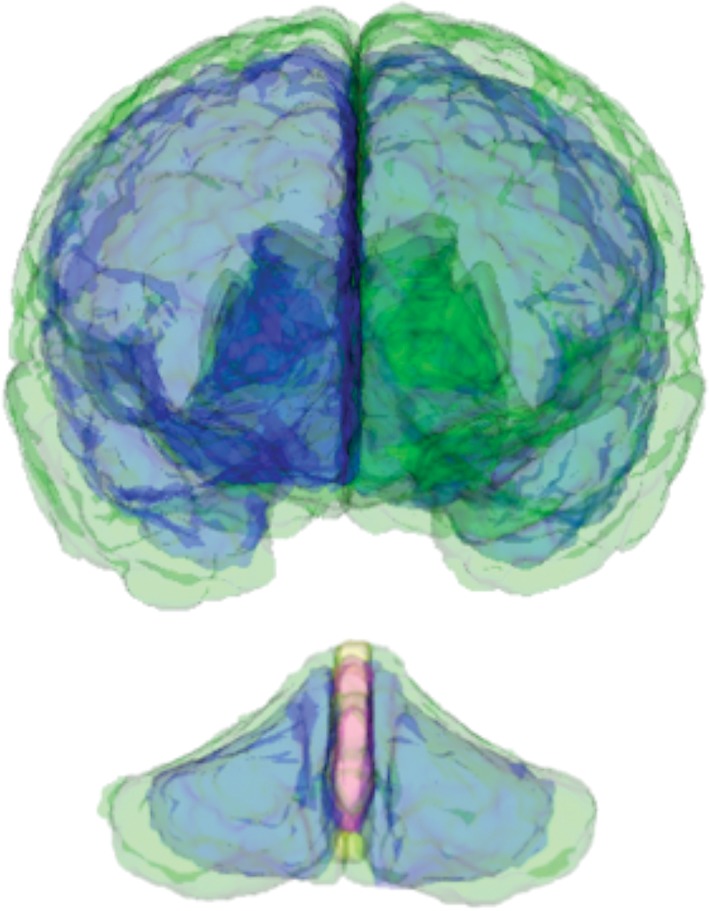
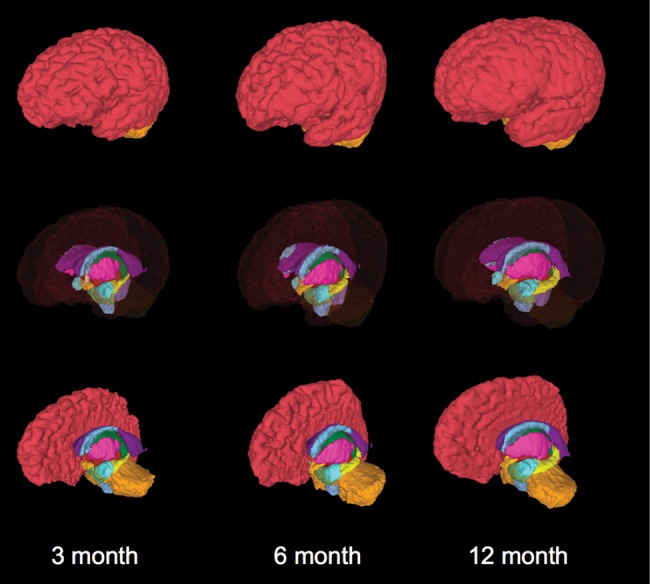
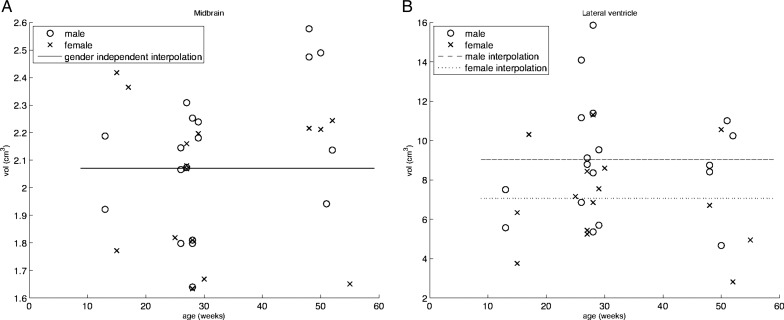
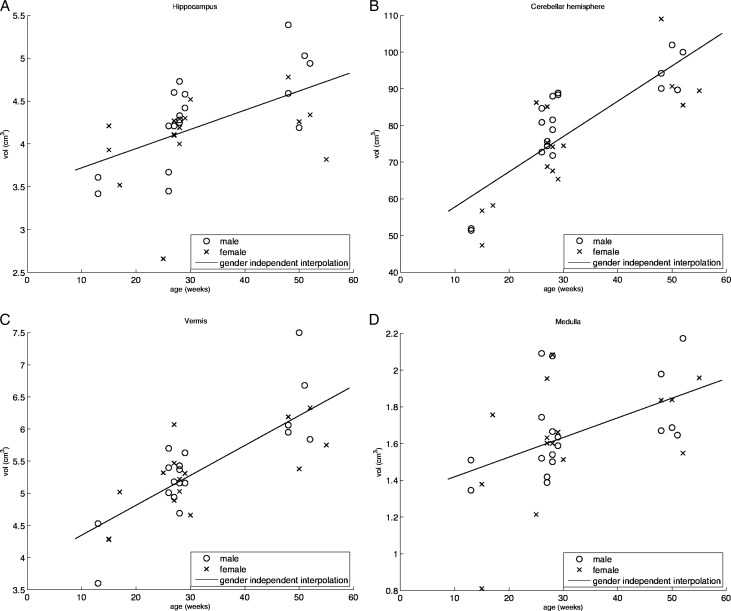
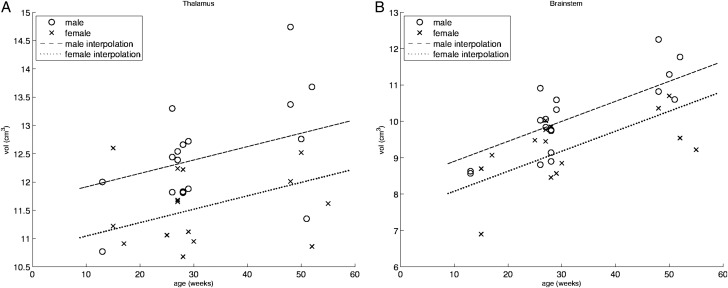
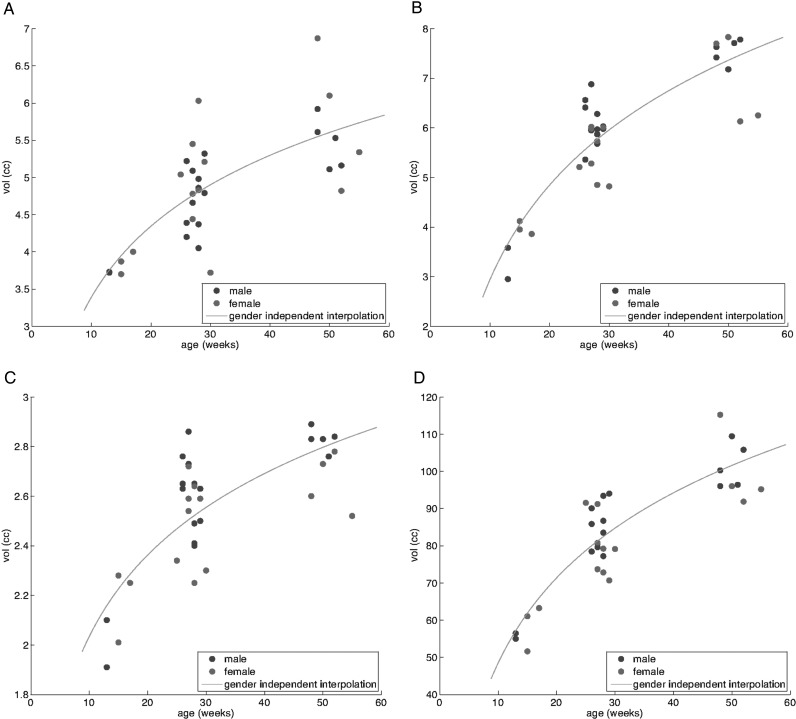
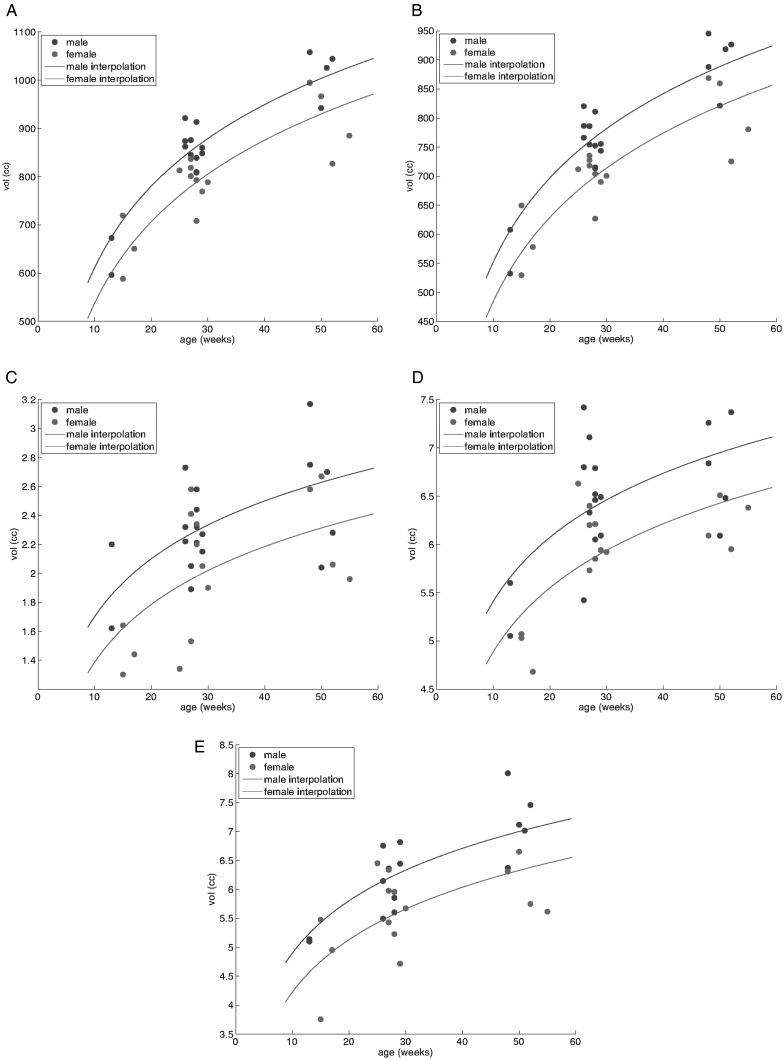
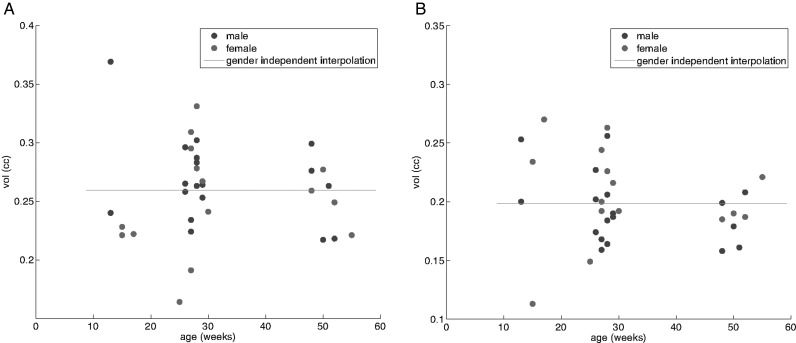
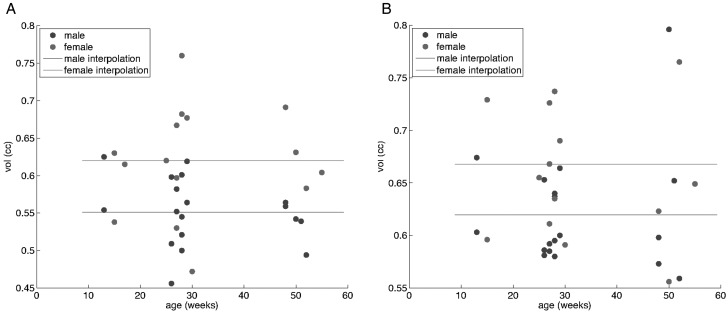
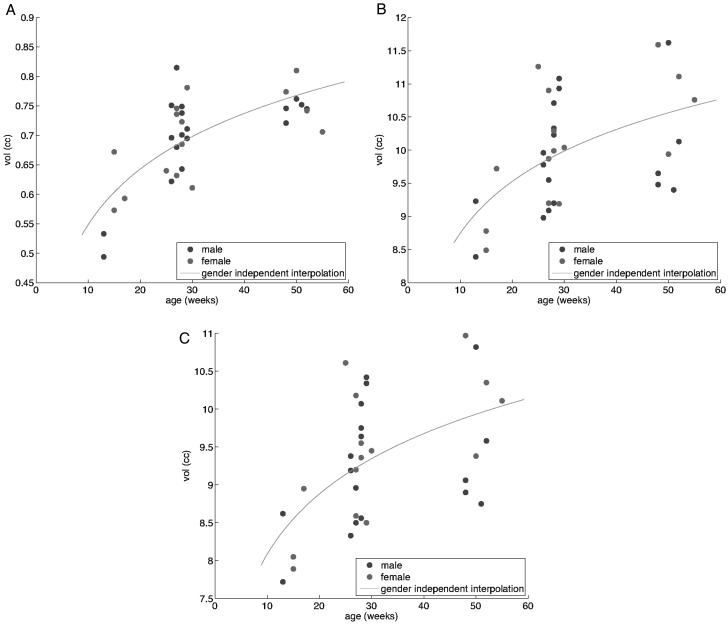
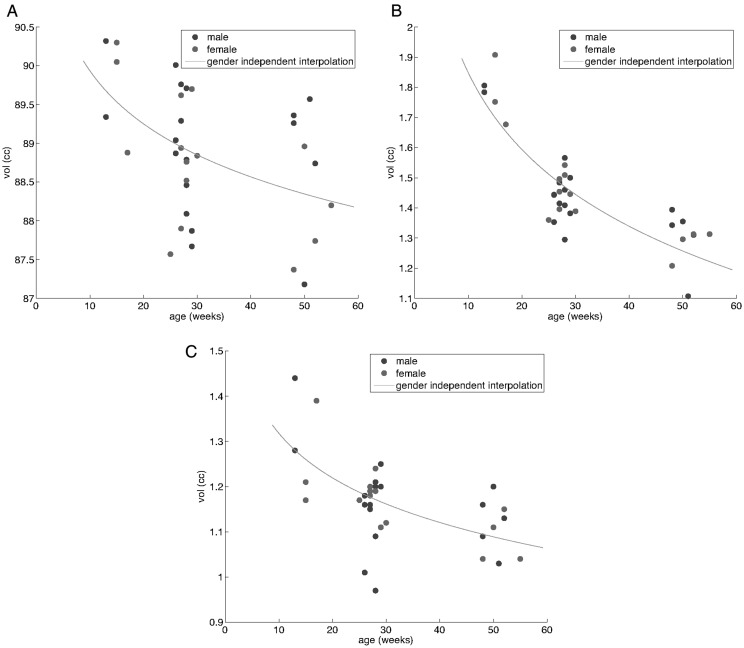
Elucidation of infant brain development is a critically important goal given the enduring impact of these early processes on various domains including later cognition and language. Although infants' whole-brain growth rates have long been available, regional growth rates have not been reported systematically. Accordingly, relatively less is known about the dynamics and organization of typically developing infant brains. Here we report global and regional volumetric growth of cerebrum, cerebellum, and brainstem with gender dimorphism, in 33 cross-sectional scans, over 3 to 13 months, using T1-weighted 3-dimensional spoiled gradient echo images and detailed semi-automated brain segmentation. Except for the midbrain and lateral ventricles, all absolute volumes of brain regions showed significant growth, with 6 different patterns of volumetric change. When normalized to the whole brain, the regional increase was characterized by 5 differential patterns. The putamen, cerebellar hemispheres, and total cerebellum were the only regions that showed positive growth in the normalized brain. Our results show region-specific patterns of volumetric change and contribute to the systematic understanding of infant brain development. This study greatly expands our knowledge of normal development and in future may provide a basis for identifying early deviation above and beyond normative variation that might signal higher risk for neurological disorders.

Keywords: MRI; brain development; infant; volumetric analysis.


Figures

Figure 1.
Figure 1.
Above: T1-weighted MRI showing segmentation of the cortical and subcortical brain regions using a thin green line in CardViews at (A) 3 months, (C) 6 months, (E) 12 months. Below: T1-weighted MRI showing color code used for identification of particular structures at (B) 3 months, (D) 6 months, (F) 12 months: Thalamus (green), deep central gray (brown), putamen (pink), globus pallidum (blue), amygdala (sky blue), hippocampi (yellow), ventricular CSF (purple), white matter (white), and cerebral gray matter (red). Note: Automatically segmented cortical volume (red) and white matter volume (white) are not accurate and not used in the current analysis. At this point, manual segmentation is required to separate cortex, myelinated and unmyelinated white matter which is beyond the scope of the current paper.
Figure 2.
Figure 2.
Overlapped 3D surface-rendered images of the semi-automatically segmented cerebrum (top) and cerebellum (below) in a sample subject at 3 and 12 months of age are shown for comparison. Blue, 3 months; green, 12 months; red, vermis of 3 months; yellow, vermis of 12 months.
Figure 3.
Figure 3.
Three-dimensional surface-rendered images of the semi-automatically and manually segmented brain regions in a sample subject at 3, 6, and 12 months. Top row shows left oblique view of all brain volumes combined. Bottom row shows brain regions after the removal of the left hemisphere. Middle row shows sub-regions in color with transparent cerebral and cerebellar hemispheres. Red, cerebral hemisphere; blue, caudate; purple, lateral ventricle; green, thalamus; pink, putamen; light blue, amygdala; yellow, hippocampus, cayenne, ventral diencephalon; orange, optic chiasm; tangerine, cerebellar hemisphere; light purple, vermis; cyan, fourth ventricle; light green, pons; blue-gray, medulla. For supplemental online 3D surface rendered images see http://babymri.org/myong-sun.choe/.
Figure 4.
Figure 4.
Scatter plot and regression analysis for absolute volume of 2 structures showing no growth with age. (A) Midbrain. No gender effect. (B) Lateral ventricle with a gender effect. Thirty-three brain scans. Fourteen boys and 11 girls. Five children were successfully scanned at both 6 and 12 months.
Figure 5.
Figure 5.
Scatter plot and regression analysis for absolute volume of 4 regions with a linear growth pattern without gender effects. (A) Hippocampus, (B) cerebellar hemisphere, (C) vermis, and (D) medulla.
Figure 6.
Figure 6.
Scatter plot and regression analysis for absolute volume of 4 regions with a linear growth pattern with a gender effect. (A) Thalamus and (B) brainstem.
Figure 7.
Figure 7.
Scatter plot and regression analysis for absolute volume of 4 regions with a logarithmic growth pattern without gender effects. (A) Caudate, (B) putamen, (C) globus pallidus and (D) cerebellum.
Figure 8.
Figure 8.
Scatter plot and regression analysis for absolute volume of 5 regions with a logarithmic growth pattern with a gender effect. (A) Whole brain, (B) cerebrum, (C) amygdala, (D) ventral diencephalon, and (E) pons.
Figure 9.
Figure 9.
Scatter plot and regression analysis for normalized brain volumes of 2 regions with no growth pattern and gender effects. (A) Amygdala and (B) medulla.
Figure 10.
Figure 10.
Scatter plot and regression analysis for normalized brain volumes of 2 regions with no growth pattern with gender effect. (A) Caudate and (B) vermis.
Figure 11.
Figure 11.
Scatter plot and regression analysis for normalized brain volumes of 5 regions with a linear decrease without gender effects. (A) Globus pallidus and (B) ventral diencephalon, (C) hippocampus, (D) midbrain, and (E) pons.
Figure 12.
Figure 12.
Scatter plot and regression analysis for normalized brain volumes of 3 regions with a logarithmic growth pattern without gender effects. (A) Putamen, (B) whole cerebellum, and (C) cerebellar hemisphere.
Figure 13.
Figure 13.
Scatter plotand regression analysis for normalized brain volumes of 3 regions with a logarithmic decrease pattern without gender effects. (A) Cerebrum, (B) thalamus, and (C) brainstem.

Similar articles

Cited by

References

    1. Barkovich AJ. Magnetic resonance techniques in the assessment of myelin and myelination. J Inherit Metab Dis. 2005;28(3):311–343. doi:10.1007/s10545-005-5952-z. - DOI - PubMed
    1. Bird CR, Hedberg M, Drayer BP, Keller PJ, Flom RA, Hodak JA. MR assessment of myelination in infants and children: Usefulness of marker sites. AJNR Am J Neuroradiol. 1989;10(4):731–740. - PMC - PubMed
    1. Bohbot VD, Kalina M, Stepankova K, Spackova N, Petrides M, Nadel L. Spatial memory deficits in patients with lesions to the right hippocampus and to the right parahippocampal cortex. Neuropsychologia. 1998;36:1217–1238. doi:10.1016/S0028-3932(97)00161-9. - DOI - PubMed
    1. Burgess N, Maguire EA, O'Keefe J. The human hippocampus and spatial and episodic memory. Neuron. 2002;35:625–641. doi:10.1016/S0896-6273(02)00830-9. - DOI - PubMed
    1. Castellanos FX, Giedd JN, Marsh WL, Hamburger SD, Vaituzis AC, Dickstein DP, Sarfatti SE, Vauss YC, Snell JW, Lange N, et al. Quantitative brain magnetic resonance imaging in attention-deficit hyperactivity disorder. Arch Gen Psychiatry. 1996;53(7):607–616. doi:10.1001/archpsyc.1996.01830070053009. - DOI - PubMed

Publication types