. 2012 Jul;24(7):2992-3008.
doi: 10.1105/tpc.112.098947. Epub 2012 Jul 6.

A flavin binding cryptochrome photoreceptor responds to both blue and red light in Chlamydomonas reinhardtii

Affiliations

A flavin binding cryptochrome photoreceptor responds to both blue and red light in Chlamydomonas reinhardtii

Benedikt Beel et al. Plant Cell. 2012 Jul.

Abstract

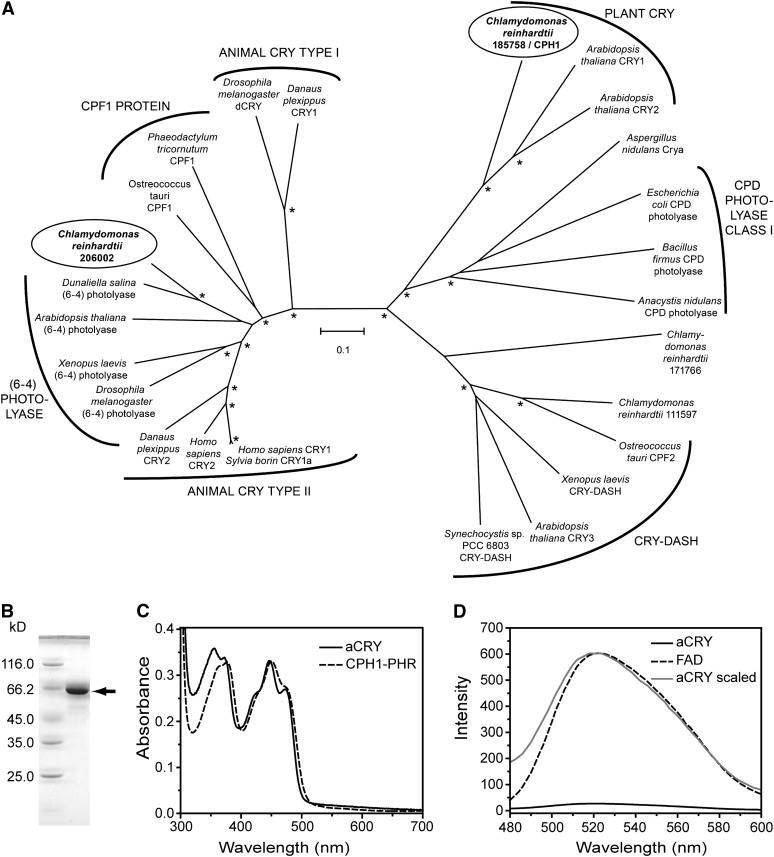
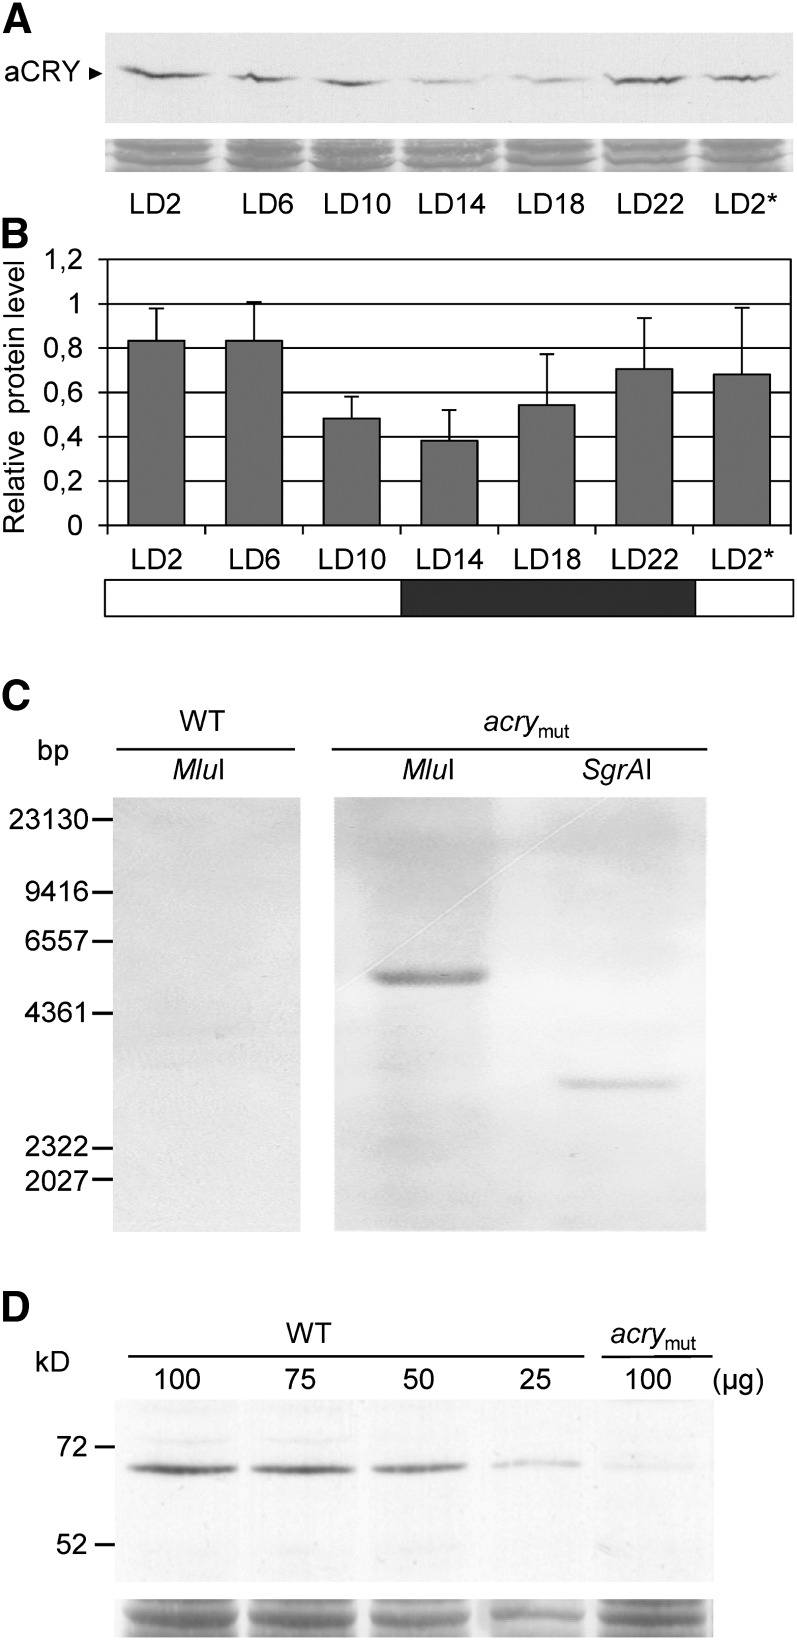
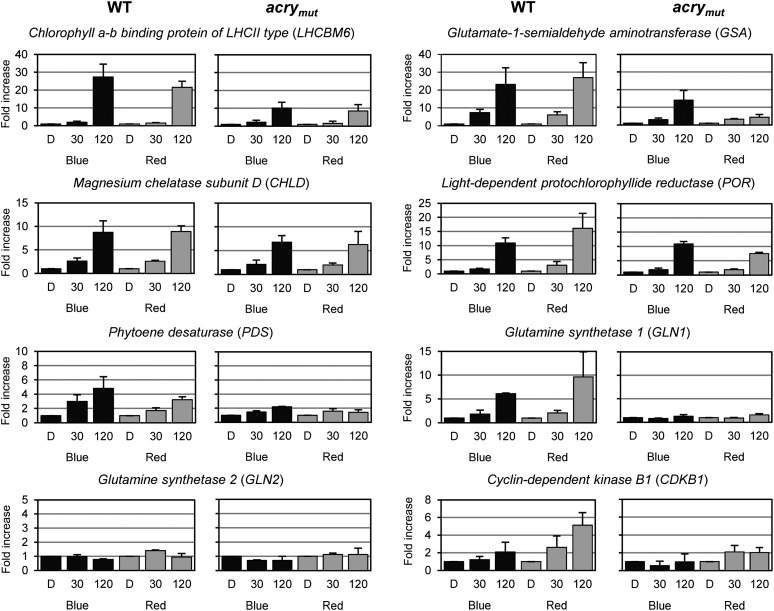
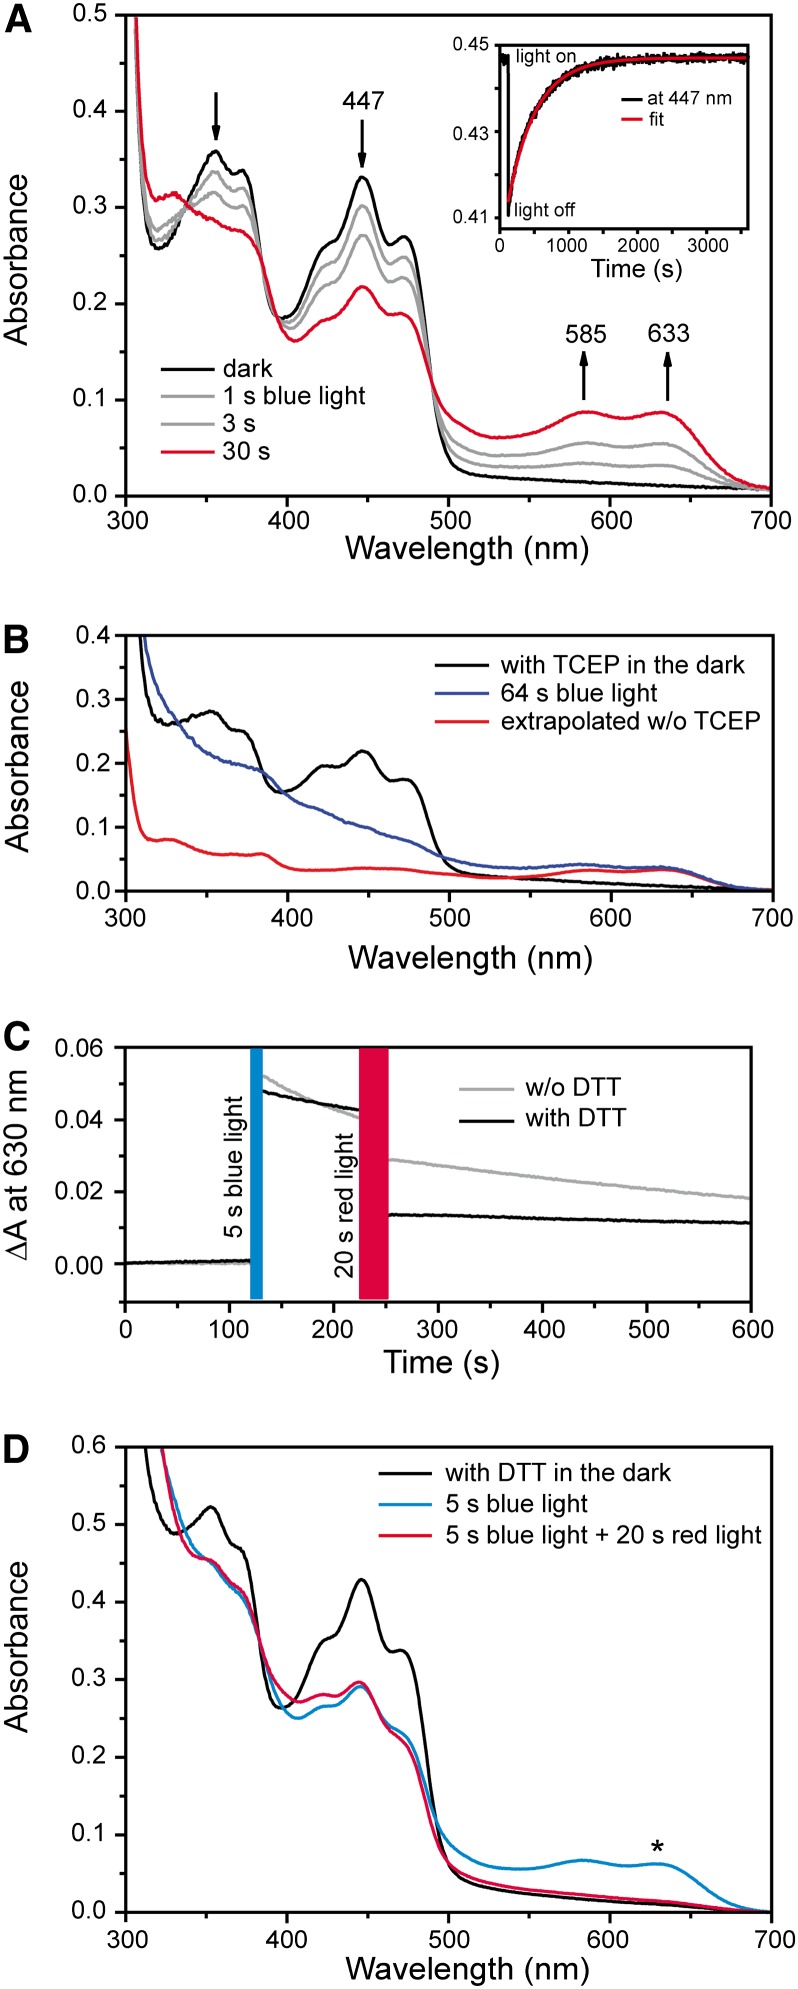
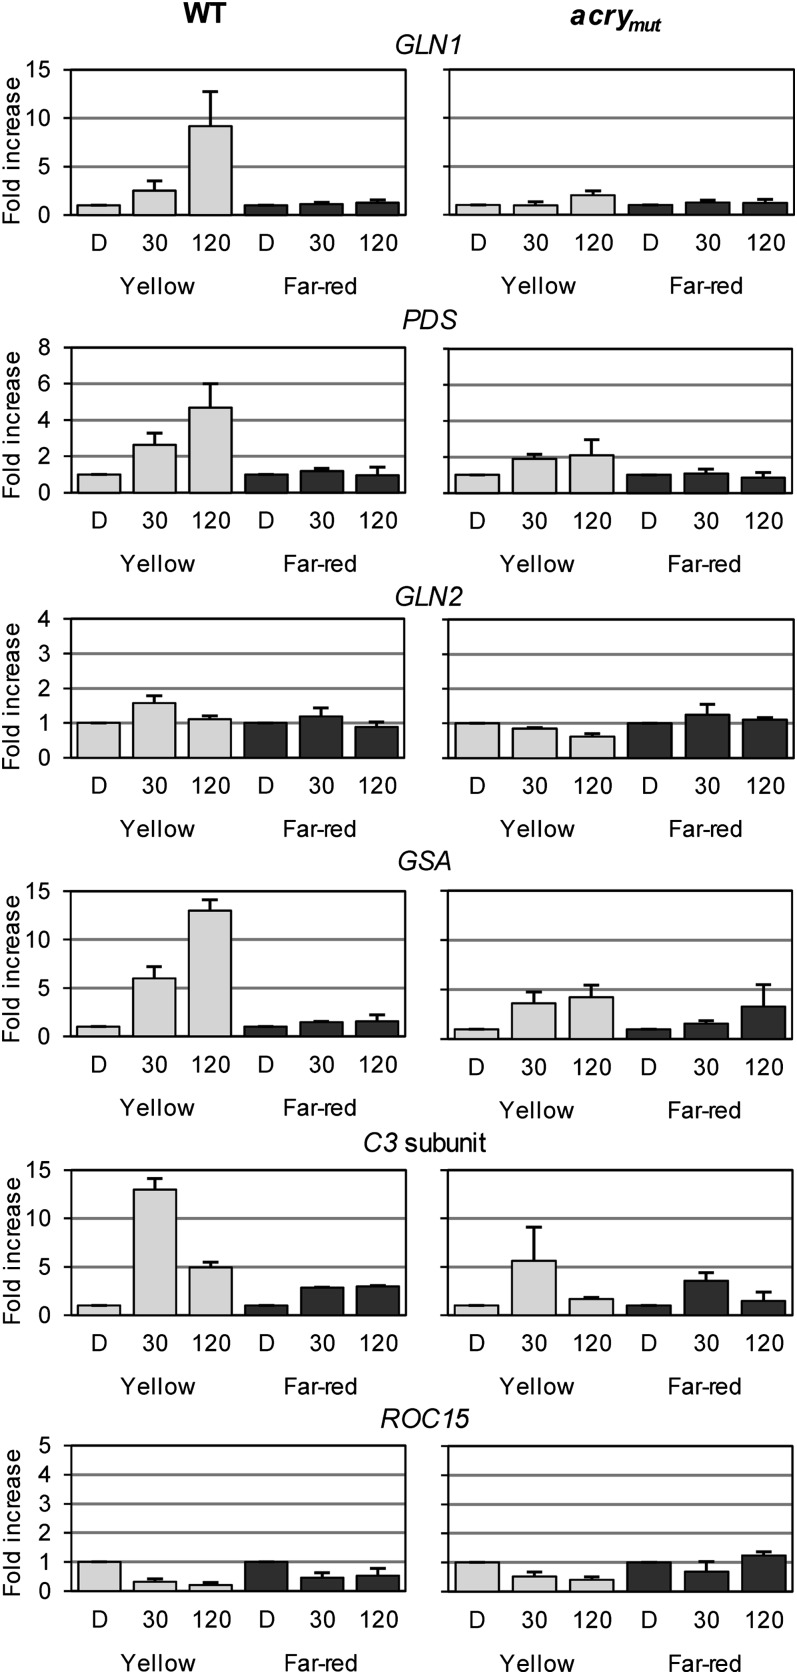
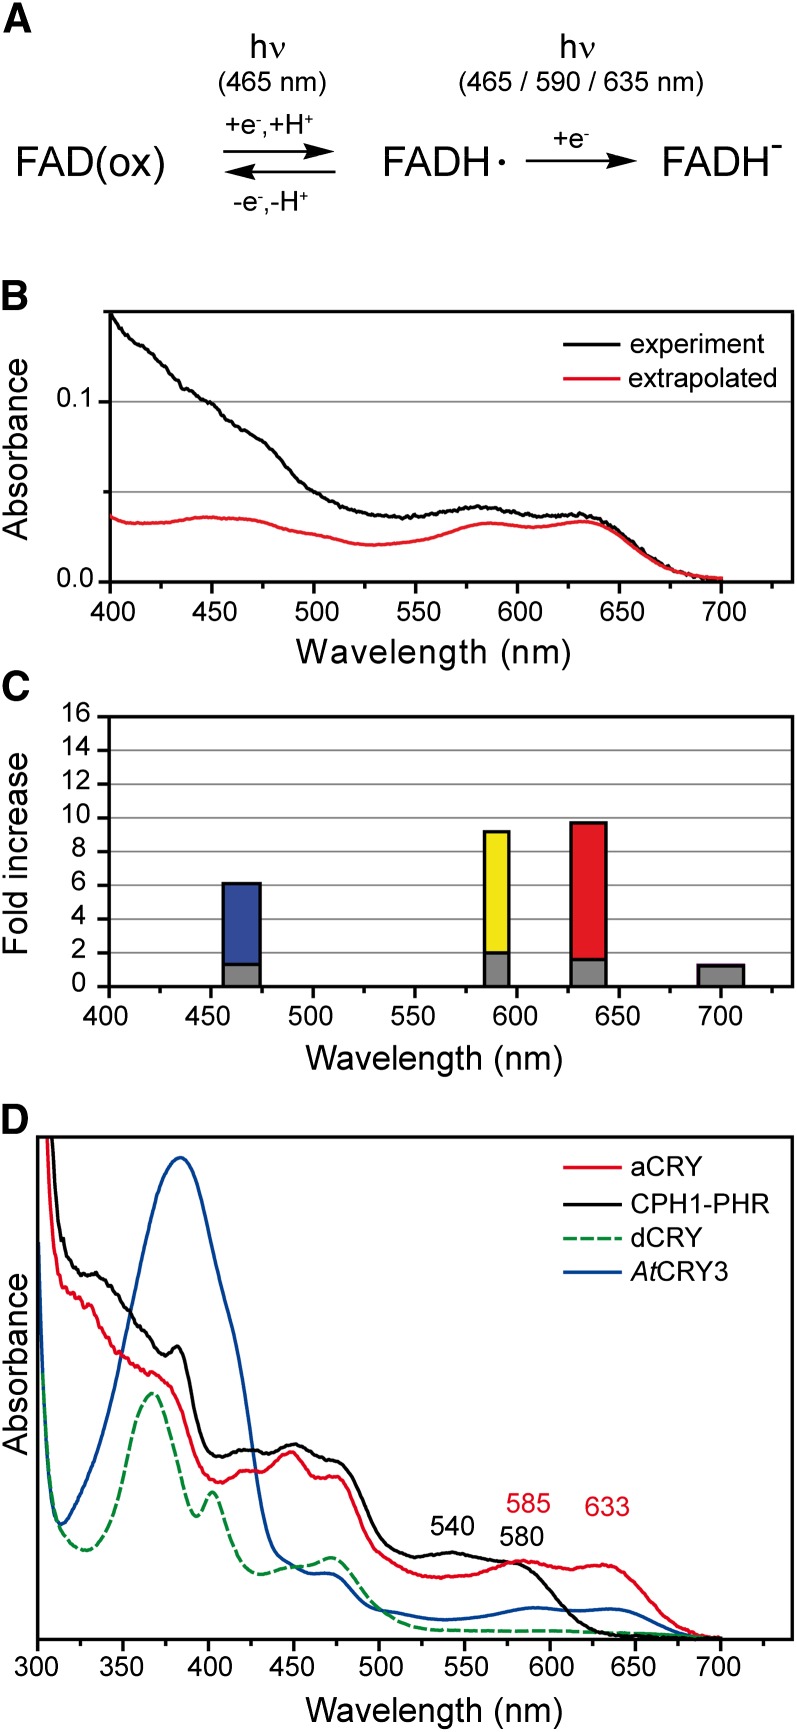
Cryptochromes are flavoproteins that act as sensory blue light receptors in insects, plants, fungi, and bacteria. We have investigated a cryptochrome from the green alga Chlamydomonas reinhardtii with sequence homology to animal cryptochromes and (6-4) photolyases. In response to blue and red light exposure, this animal-like cryptochrome (aCRY) alters the light-dependent expression of various genes encoding proteins involved in chlorophyll and carotenoid biosynthesis, light-harvesting complexes, nitrogen metabolism, cell cycle control, and the circadian clock. Additionally, exposure to yellow but not far-red light leads to comparable increases in the expression of specific genes; this expression is significantly reduced in an acry insertional mutant. These in vivo effects are congruent with in vitro data showing that blue, yellow, and red light, but not far-red light, are absorbed by the neutral radical state of flavin in aCRY. The aCRY neutral radical is formed following blue light absorption of the oxidized flavin. Red illumination leads to conversion to the fully reduced state. Our data suggest that aCRY is a functionally important blue and red light-activated flavoprotein. The broad spectral response implies that the neutral radical state functions as a dark form in aCRY and expands the paradigm of flavoproteins and cryptochromes as blue light sensors to include other light qualities.


Figures

Figure 1.
Figure 1.
Phylogenetic Position of aCRY and Characterization of Heterologously Expressed aCRY. (A) aCRY from C. reinhardtii (gene 206002; circled) groups with type II animal CRYs, (6-4) photolyases, and CPF1 proteins but not with the CPH1 plant CRY from C. reinhardtii (gene 185758; circled). For simplicity, photolyases other than members of cyclobutane pyrimidine dimer (CPD) class I and (6-4) were omitted. Bootstrap values larger than 95% are indicated by asterisks. Numbering of uncharacterized sequences from C. reinhardtii is according to Joint Genome Institute Chlre version 4.0. The scale bar indicates amino acid substitutions per site. (B) SDS-PAGE of heterologously expressed, full-length aCRY with a His tag. A single band is detected and marked with an arrow. This band migrates to a position that aligns with the marker protein BSA at a molecular mass of 66.2 kD. (C) UV/Vis spectrum of purified aCRY. The absorption spectrum shows the characteristic pattern of protein-bound, oxidized flavin with absorbance maxima at ∼360 and 447 nm. The spectrum differs from that of the PHR domain of CPH1, the plant CRY of C. reinhardtii (dashed line), which suggests a different hydrogen bonding environment of the flavin. (D) Fluorescence emission spectrum of aCRY excited at 447 nm (solid line) as compared with that of free FAD (dashed line). The weak emission of FAD is further reduced by binding to aCRY. A scaled trace of aCRY (gray) demonstrates the shift in the fluorescence maximum of free FAD by 2 nm in native aCRY.
Figure 2.
Figure 2.
Expression of aCRY over a Diurnal Cycle and Characterization of an acry Mutant. (A) C. reinhardtii wild-type cells were grown under a LD12:12 cycle and harvested at the indicated time points. The asterisk indicates the beginning of the next light period at LD2. Equal amounts of proteins from crude extracts (either 75 or 100 µg of protein per time point, depending on the biological replicate) were separated by 10% SDS-PAGE along with molecular mass standards and immunoblotted using anti-aCRY antibodies. To control for equal amounts of proteins loaded, the PVDF membrane was stained with Coomassie Brilliant Blue R 250 after immunological detection. From this stain, selected, unspecified protein bands are shown (bottom). (B) Quantification of aCRY protein levels using ImageMaster 2D Elite version 4.01 (GE Healthcare). The highest level of protein for each set of experiments (n = 3) was set to 1. White bar, light; black bar, darkness. (C) DNA gel blot analysis of genomic DNA from the SAG73.72 wild-type strain (WT) and the mutant strain SAG.73.72:acry1A (acrymut). Thirty micrograms of genomic DNA was digested with MluI and SgrAI, as indicated. DNA fragments were separated on a 0.8% agarose gel and blotted onto a nylon membrane. A labeled APHVIII cassette fragment was used as the hybridization probe (see Methods). The positions of the restriction sites are shown in Supplemental Figure 3A online. (D) Immunoblot analysis of aCRY protein in the wild type and acrymut. Cells were harvested at LD6 and used to make crude extracts. Different amounts of protein from a crude extract of wild-type cells (100, 75, 50, and 25 µg per lane) as well as 100 µg of protein from a crude extract of acrymut were separated by 10% SDS-PAGE along with molecular mass standards and immunoblotted with anti-aCRY antibodies. To control for the different protein load, the PVDF membrane was stained with Coomassie Brilliant Blue R 250 after immunological detection. From this stain, one selected, unspecified band is shown (bottom). Quantification of the aCRY protein level was done as described in (B) (n = 3).
Figure 3.
Figure 3.
Blue (465 nm) and Red (635 nm) Light-Dependent Changes in Transcript Accumulation of Genes Encoding Metabolic Proteins and a Cell Cycle Component. Transcript accumulation was quantified by RT-qPCR in the wild type (WT) and acrymut. Cells were grown in a light/dark cycle. At the end of the light period, cells were maintained for 60 h in darkness (D) before exposure to 30 and 120 min of either blue or red light (see Methods). LEDs with an energy fluence rate of 2.6 W/m2 were used. Total RNA was isolated, and equal amounts were used for RT-qPCR with RACK1 as a reference gene for normalization. The changes in transcript levels following exposure of the cells to blue or red light are presented as fold change relative to RNA from dark-grown cells. Each experiment was performed in triplicate from at least two different biological samples. Bars show means and sd.
Figure 4.
Figure 4.
Blue (465 nm) and Red (635 nm) Light-Dependent Changes in Transcript Accumulation of Genes Encoding Circadian Clock–Relevant Components. Experiments were performed as described in Figure 3. Each experiment was performed in triplicate from at least two different biological samples. Bars show means and sd. WT, wild type.
Figure 5.
Figure 5.
Conversion of the Oxidized State of aCRY to the Radical State upon Blue Light Illumination and the Effect of Red Light on the Radical State of aCRY. (A) UV/Vis spectra of aCRY were recorded before and after blue light illumination for the indicated time intervals. The inset shows a representative kinetic of the recovery of the oxidized state in the dark as measured at 447 nm. A time constant of 450 s was determined by a monoexponential fit. (B) UV/Vis spectra before and after illumination for 64 s in the presence of the reductant TCEP. The oxidized state was completely converted to the neutral radical state of flavin. To illustrate the contribution of light scattering, a spectrum of the neutral radical was extrapolated from the reaction sequence in (A). (C) The presence of the neutral radical state was monitored by UV/Vis spectroscopy at 630 nm with and without the reductant DTT. Preillumination with blue light leads to formation of the flavin radical, which decays in the dark to the oxidized state. Subsequent exposure to red light results in a significant additional loss of the flavin radical state. In the presence of DTT, the decay in the dark is slowed and the effect of red light becomes more pronounced. (D) Corresponding UV/Vis spectra show that red light illumination leads to a decay of the neutral radical but not to a recovery of the oxidized state. The asterisk indicates the wavelength at which traces were recorded in (C).
Figure 6.
Figure 6.
Yellow (590 nm) and Far-Red (700 nm) Light-Dependent Expression of Genes Encoding Metabolic Proteins and Clock-Relevant Components in the Wild Type and acrymut. Experiments were performed as described in Figure 3, but cells were exposed to either yellow or far-red light. Each experiment was performed in triplicate from at least two different biological samples. Bars show means and sd. WT, wild type.
Figure 7.
Figure 7.
Reaction Sequence of aCRY and Comparison of the Absorption Spectrum of the Neutral Radical with in Vivo Responses to Light of Different Spectral Qualities and with Absorption Spectra of FAD Radical States of Other CRYs. (A) The three redox states associated with aCRY in vitro (i.e., oxidized, neutral radical, and fully reduced FAD) are depicted. At the specified wavelengths of light, a conversion of oxidized to neutral radical or of neutral radical to the fully reduced state of FAD takes place. (B) The absorption spectrum of the flavin neutral radical of aCRY is shown for comparison according to Figure 5B. (C) Relative increase in the accumulation of GLN1 mRNA after exposure to different light qualities (i.e., blue, yellow, red, and far-red light) for 120 min. Responses in both the wild type (colored bars) and the acry mutant (gray bars) are shown. The width of the bars corresponds to the FWHM of the respective LED emission spectrum. (D) For comparison, C. reinhardtii CPH1 was selected as a representative plant CRY. It shows the blue shift of the local absorption maxima of the neutral radical to 540 and 580 nm, which is characteristic for a plant CRY. dCRY, an animal type I CRY from Drosophila, forms the anion radical with an absorption maximum at 367 nm and weak absorption at >510 nm. Arabidopsis CRY3 is a member of DASH CRYs and contains an antenna chromophore with pronounced absorption at 384 nm. All spectra contain some additional contributions from the oxidized state at <500 nm.

Similar articles

Cited by

References

    1. Alizadeh D., Cohen A. (2010). Red light and calmodulin regulate the expression of the psbA binding protein genes in Chlamydomonas reinhardtii. Plant Cell Physiol. 51: 312–322 - PMC - PubMed
    1. Altimus C.M., Güler A.D., Villa K.L., McNeill D.S., Legates T.A., Hattar S. (2008). Rods-cones and melanopsin detect light and dark to modulate sleep independent of image formation. Proc. Natl. Acad. Sci. USA 105: 19998–20003 - PMC - PubMed
    1. Balland V., Byrdin M., Eker A.P., Ahmad M., Brettel K. (2009). What makes the difference between a cryptochrome and DNA photolyase? A spectroelectrochemical comparison of the flavin redox transitions. J. Am. Chem. Soc. 131: 426–427 - PubMed
    1. Banerjee R., Schleicher E., Meier S., Viana R.M., Pokorny R., Ahmad M., Bittl R., Batschauer A. (2007). The signaling state of Arabidopsis cryptochrome 2 contains flavin semiquinone. J. Biol. Chem. 282: 14916–14922 - PubMed
    1. Berndt A., Kottke T., Breitkreuz H., Dvorsky R., Hennig S., Alexander M., Wolf E. (2007). A novel photoreaction mechanism for the circadian blue light photoreceptor Drosophila cryptochrome. J. Biol. Chem. 282: 13011–13021 - PubMed

Publication types

MeSH terms

LinkOut - more resources