. 2012 Jul;24(7):2719-31.
doi: 10.1105/tpc.112.098061. Epub 2012 Jul 5.

Genome-wide identification of regulatory DNA elements and protein-binding footprints using signatures of open chromatin in Arabidopsis

Affiliations

Genome-wide identification of regulatory DNA elements and protein-binding footprints using signatures of open chromatin in Arabidopsis

Wenli Zhang et al. Plant Cell. 2012 Jul.

Abstract

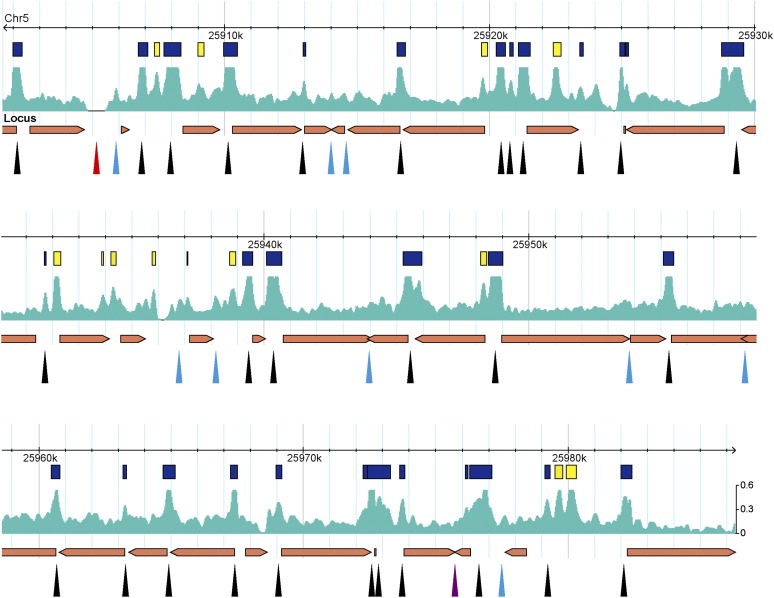
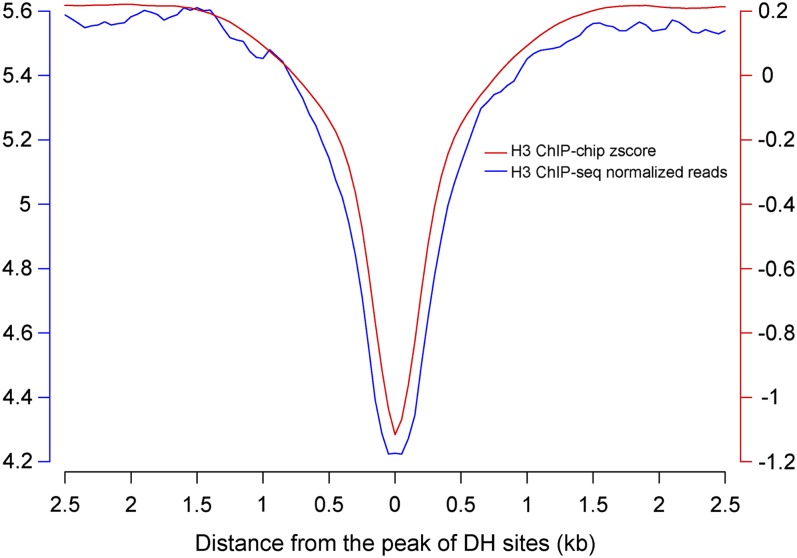
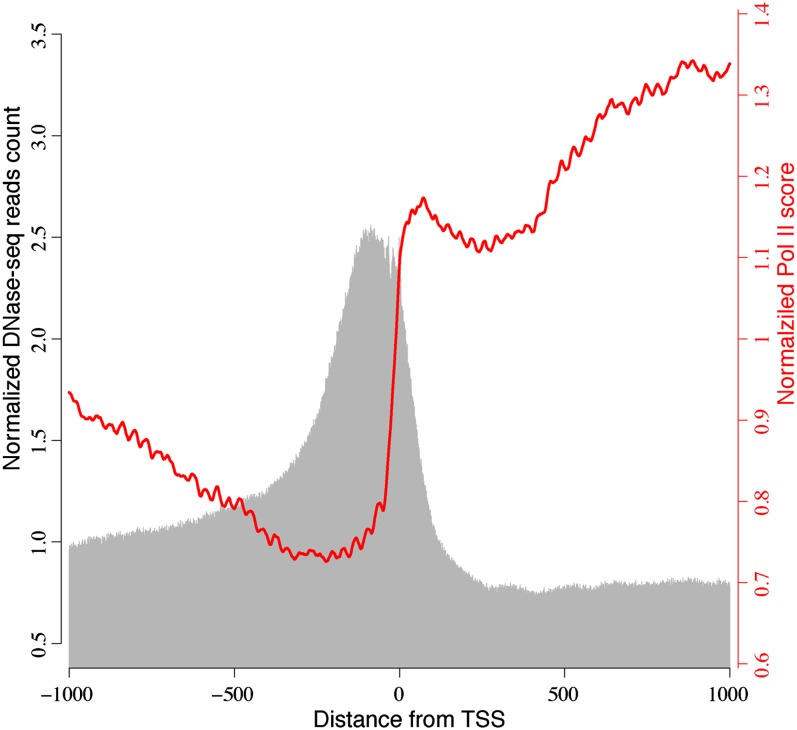
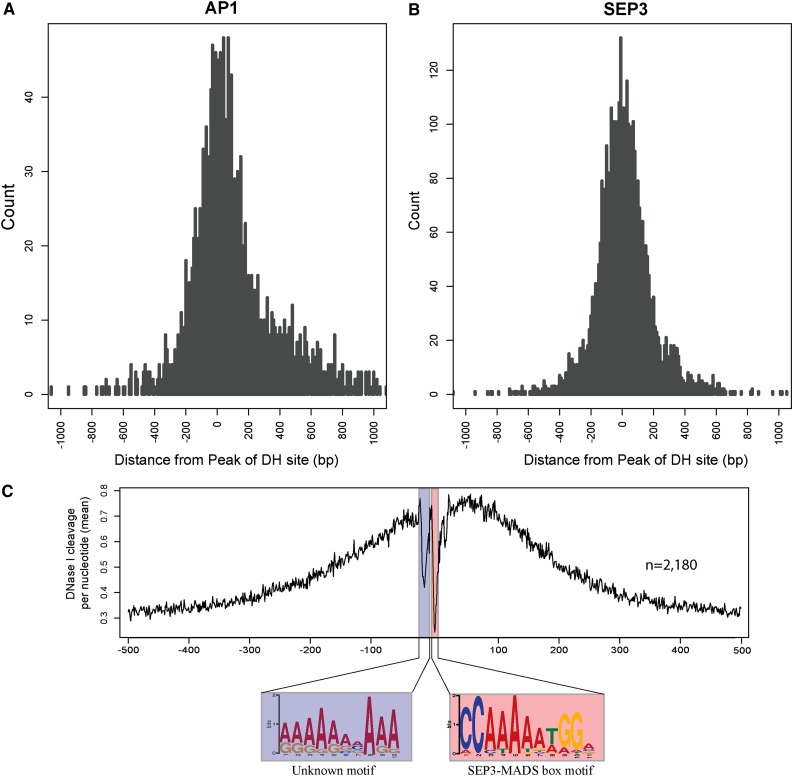
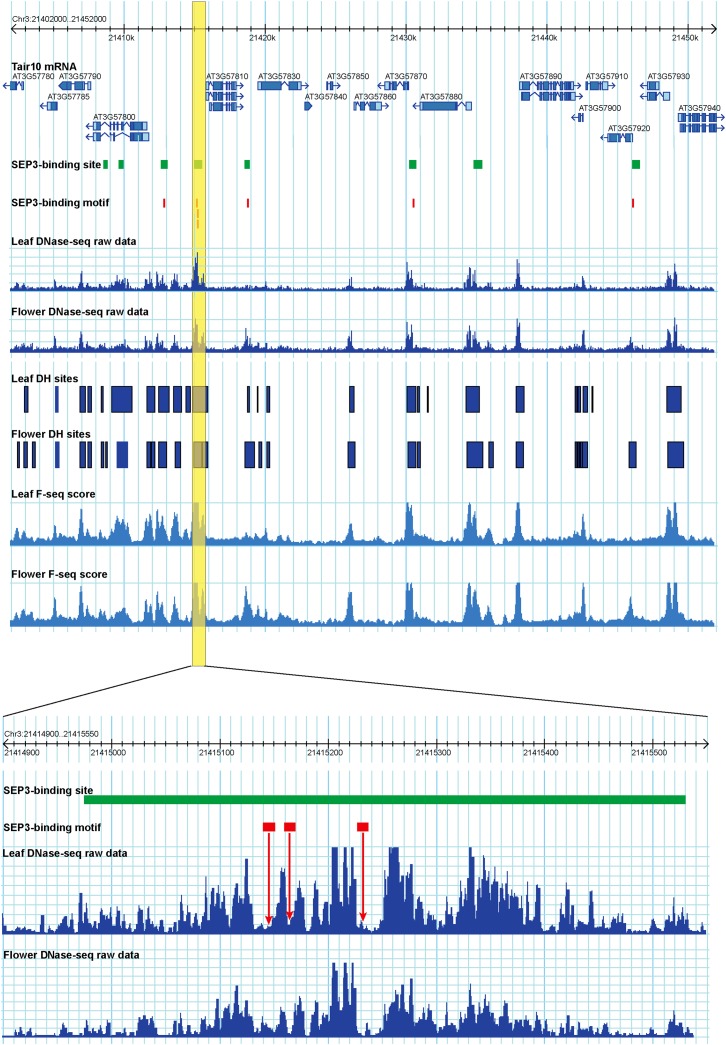
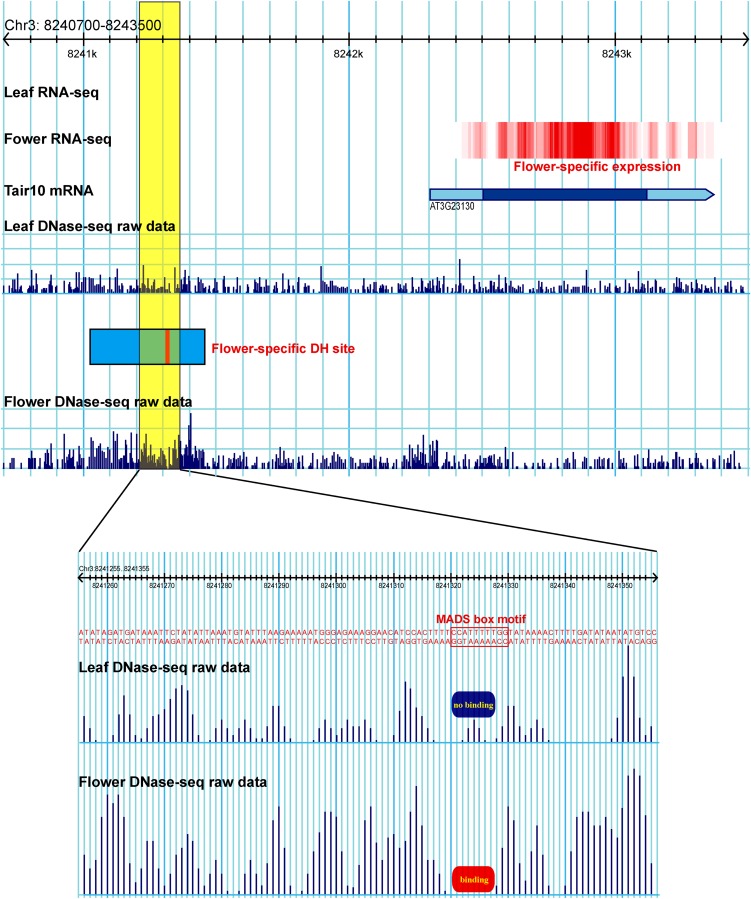
Gene expression and regulation in eukaryotes is controlled by orchestrated binding of regulatory proteins, including both activators and repressors, to promoters and other cis-regulatory DNA elements. An increasing number of plant genomes have been sequenced; however, a similar effort to the ENCODE project, which aimed to identify all functional elements in the human genome, has yet to be initiated in plants. Here we report genome-wide high-resolution mapping of DNase I hypersensitive (DH) sites in the model plant Arabidopsis thaliana. We identified 38,290 and 41,193 DH sites in leaf and flower tissues, respectively. The DH sites were depleted of bulk nucleosomes and were tightly associated with RNA polymerase II binding sites. Approximately 90% of the binding sites of two well-characterized MADS domain transcription factors, APETALA1 and SEPALLATA3, were covered by the DH sites. We demonstrate that protein binding footprints within a specific genomic region can be revealed using the DH site data sets in combination with known or putative protein binding motifs and gene expression data sets. Thus, genome-wide DH site mapping will be an important tool for systematic identification of all cis-regulatory DNA elements in plants.


Figures

Figure 1.
Figure 1.
DH Sites Identified within an 80-kb Region on the Long Arm of Chromosome 5. Boxes (yellow and blue colors) represent DH sites identified by DNase-seq. Arrowheads point to the DH sites identified using the traditional gel blot hybridization technique (Kodama et al., 2007). Black arrowheads overlap with DH sites identified by DNase-seq. Blue arrowheads point to regions that are close to the threshold to be DH sites in the DNase-seq data set. A red arrowhead points to a region that was filtered out in the DNase-seq data set. Yellow boxes and a purple arrowhead point to the DH sites that do not overlap between DNase-seq and traditional DNase-seq.
Figure 2.
Figure 2.
Distribution of DH Sites (Leaf Tissue) along Chromosome 4. (A) The y axis shows normalized read counts in 100-kb windows. The short and long horizontal red bars mark the locations of a heterochromatin knob and the pericentromeric heterochromatin on chromosome 4. (B) The y axis represents log2-fold change (log2FC) of normalized read counts between ddm1 leaf tissue and wild-type leaf tissue in 100-kb windows. Red, blue, and green lines indicate the levels of CG, CHG, and CHH methylation, respectively, in 100-kb windows (data from wild-type leaf tissue [Cokus et al., 2008]). The x axis shows the DNA sequence position on chromosome 4.
Figure 3.
Figure 3.
Genomic Locations of DH Sites Relative to Genes and Transposable Elements. The x axis shows the percentage of DH sites associated with each type of genomic location.
Figure 4.
Figure 4.
Pairwise Comparisons of DH Sites Identified from Four Different Tissue Types. The Venn diagram shows tissue-specific DH sites as well as overlaps of DH sites found in leaf and flower of ddm1 and the wild type.
Figure 5.
Figure 5.
H3 Nucleosome Occupancy in DH Sites. The x axis represents the distance from the peak of the DH sites. The y axes represent relative levels of nucleosome occupancy based on ChIP-chip z score or ChIP-seq normalized sequence reads.
Figure 6.
Figure 6.
Association between DH Sites and Pol II Binding Sites near TSS. The x axis is distance (bp) from TSS. Gray bars represent normalized DNase-seq read count within ±1 kb regions of TSS. Red line represents normalized ChIP-chip Pol II score within ±1 kb regions of TSS. [See online article for color version of this figure.]
Figure 7.
Figure 7.
Association of Transcription Factors AP1 and SEP3 Binding Sites with DH Sites (All Data from Flower Tissue). (A) Distribution of distance between the peaks of AP1 binding sites and the peaks of DH sites. The y axis represents the DNase-seq read count in 10-bp windows. (B) Distribution of distance between the peaks of SEP3 binding sites and the peaks of DH sites. The y axis represents the DNase-seq read count in 10-bp windows. (C) SEP3 binding footprints revealed by DH sites that overlap with SEP3 binding sites. The x axis represents the distance from the SEP3 motif, and the y axis represents the DNase I cut per nucleotide (mean).
Figure 8.
Figure 8.
Footprints Associated with SEP3 Binding Sites. A 50-kb region on chromosome 3 contains eight SEP3 binding sites (green boxes) that are all associated with a DH site in one or both tissues. A total of seven CC[A/T]6GG motifs (red bars) are found in five SEP3 binding sites. A region containing three CC[A/T]6GG motifs (yellow box) is enlarged. A DNase I cleavage footprint was associated with each of the three motifs (red arrows). TE, transposable elements; TTS, transcription terminal site; UTR, untranslated region.
Figure 9.
Figure 9.
Footprint Associated with the MADS Box Motif in the Promoter of the SUP Gene. A DH site (blue box) was detected in the flower tissue. A MADS box motif (red bar) is located within the DH site. A portion of the DH site (yellow box) is enlarged. Seven bases of the MADS box motif were devoid of DNase I cuts in flower tissue, leaving a protein binding footprint in this region. By contrast, DNase I cuts were associated with the same bases in the leaf tissue.

References

    1. Arabidopsis Genome Initiative (2000). Analysis of the genome sequence of the flowering plant Arabidopsis thaliana. Nature 408: 796–815 - PubMed
    1. Ausubel F.M. (2002). Summaries of National Science Foundation-sponsored Arabidopsis 2010 projects and National Science Foundation-sponsored plant genome projects that are generating Arabidopsis resources for the community. Plant Physiol. 129: 394–437
    1. Badis G., et al. (2009). Diversity and complexity in DNA recognition by transcription factors. Science 324: 1720–1723 - PMC - PubMed
    1. Bailey T.L., Elkan C. (1994). Fitting a mixture model by expectation maximization to discover motifs in biopolymers. Proc. Int. Conf. Intell. Syst. Mol. Biol. 2: 28–36 - PubMed
    1. Birnbaum K., Shasha D.E., Wang J.Y., Jung J.W., Lambert G.M., Galbraith D.W., Benfey P.N. (2003). A gene expression map of the Arabidopsis root. Science 302: 1956–1960 - PubMed

Publication types

MeSH terms

Associated data