. 2012 Sep;5(5):636-48.
doi: 10.1242/dmm.009266. Epub 2012 Jul 5.

Accelerated renal disease is associated with the development of metabolic syndrome in a glucolipotoxic mouse model

Affiliations

Accelerated renal disease is associated with the development of metabolic syndrome in a glucolipotoxic mouse model

Cristina Martínez-García et al. Dis Model Mech. 2012 Sep.

Abstract

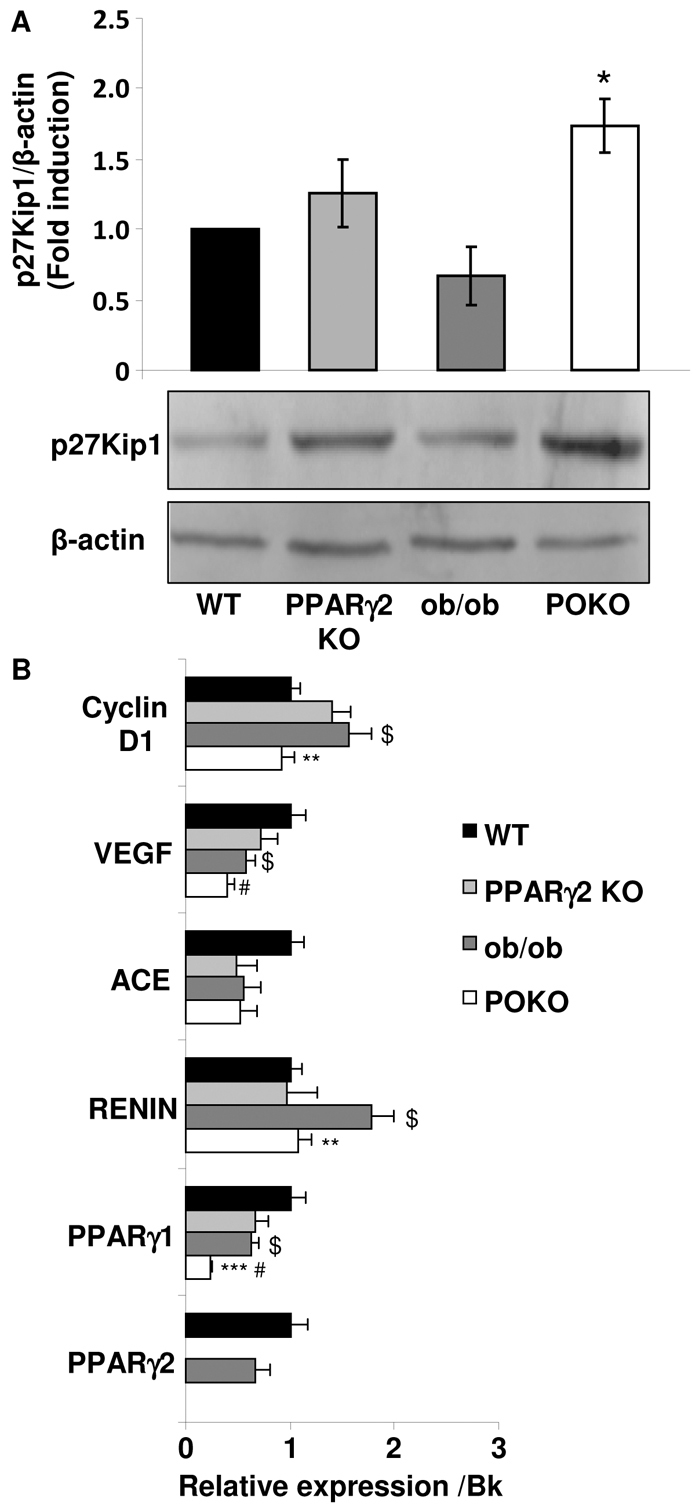
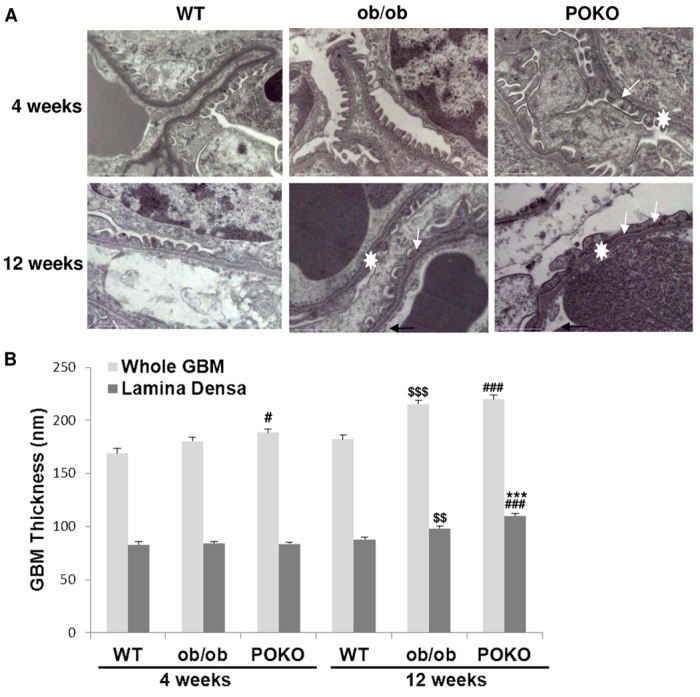
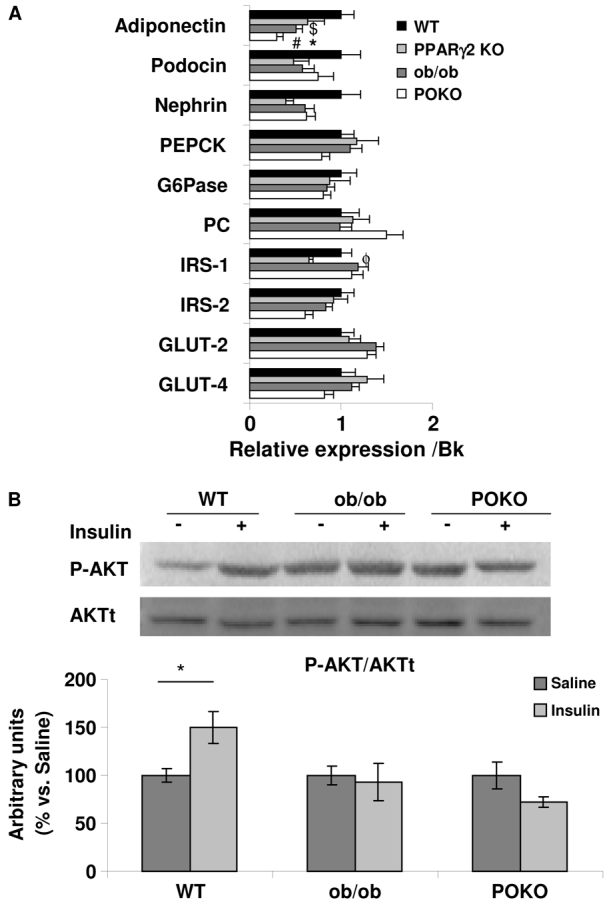
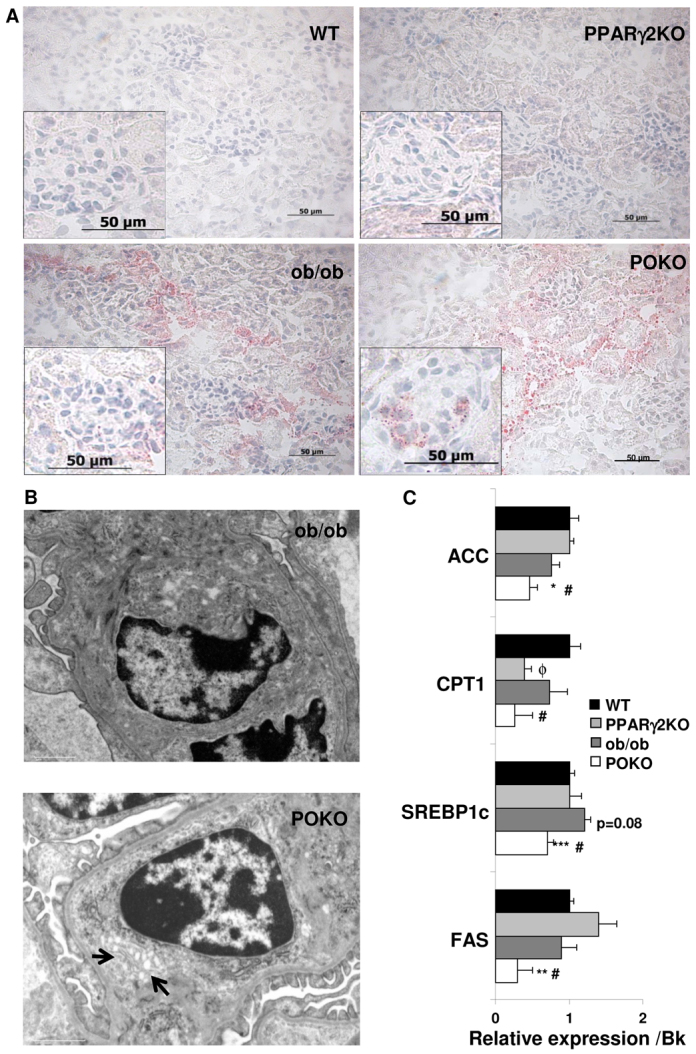
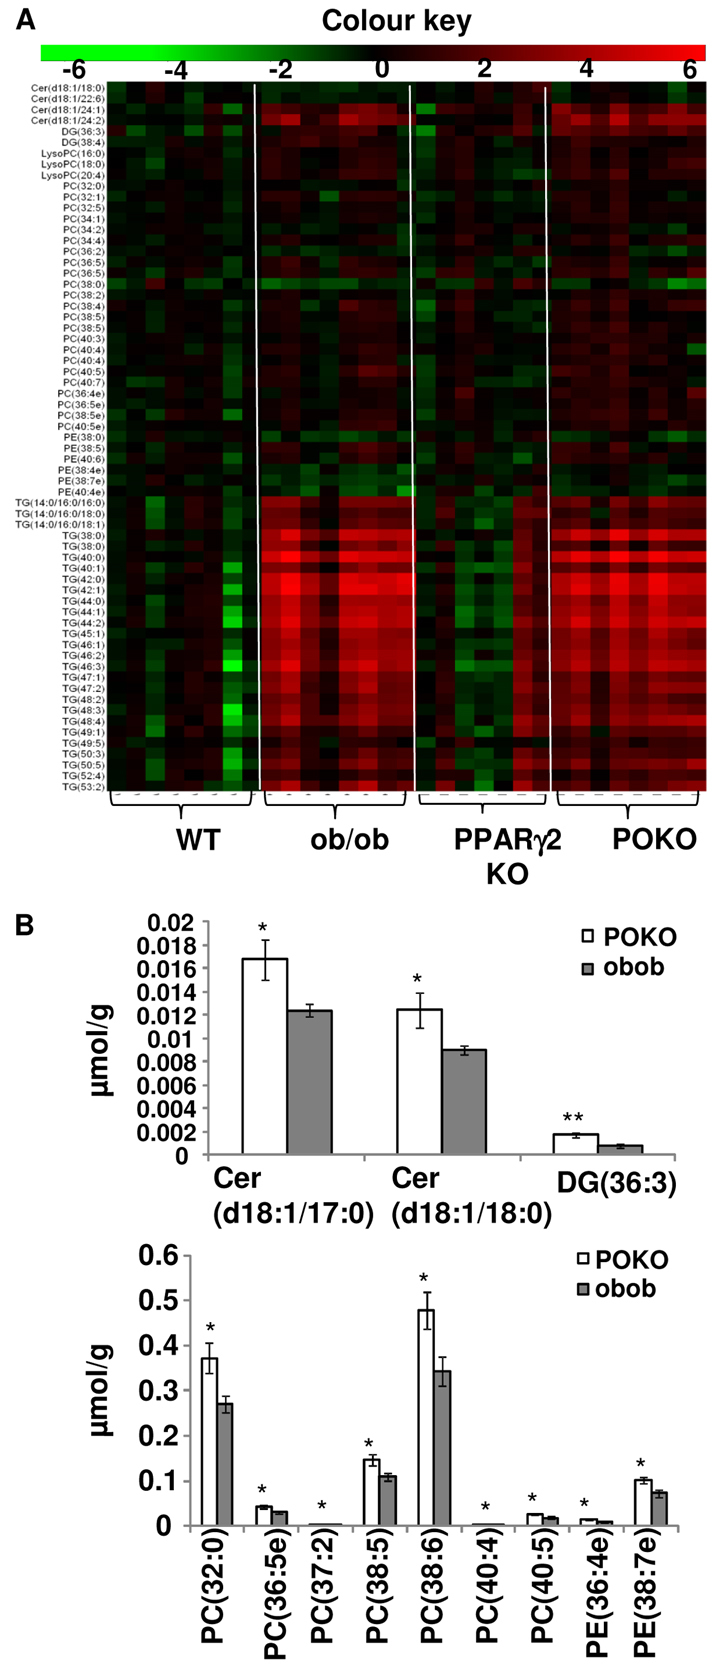
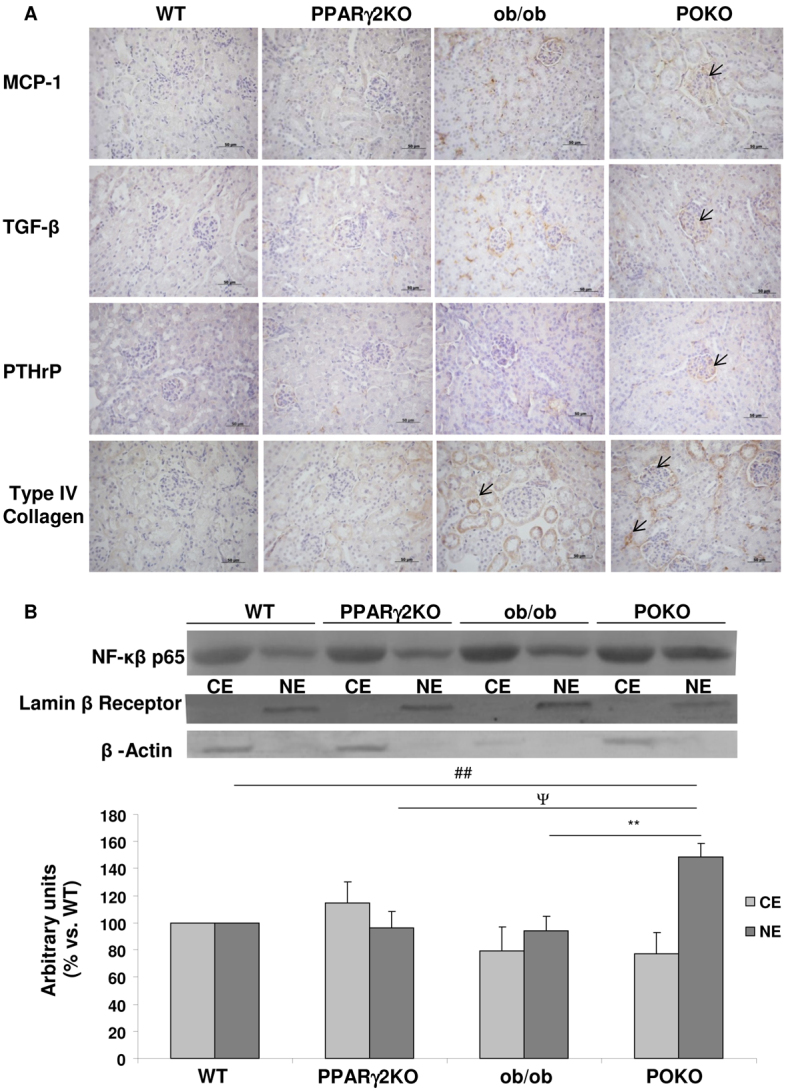
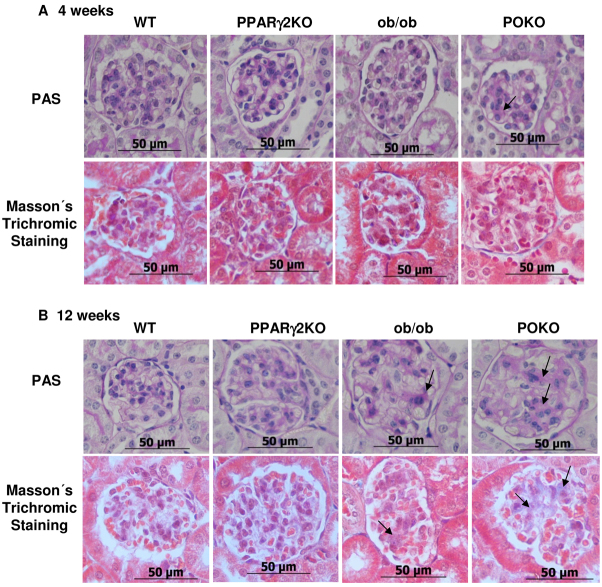
Individuals with metabolic syndrome are at high risk of developing chronic kidney disease (CKD) through unclear pathogenic mechanisms. Obesity and diabetes are known to induce glucolipotoxic effects in metabolically relevant organs. However, the pathogenic role of glucolipotoxicity in the aetiology of diabetic nephropathy is debated. We generated a murine model, the POKO mouse, obtained by crossing the peroxisome proliferator-activated receptor gamma 2 (PPARγ2) knockout (KO) mouse into a genetically obese ob/ob background. We have previously shown that the POKO mice showed: hyperphagia, insulin resistance, hyperglycaemia and dyslipidaemia as early as 4 weeks of age, and developed a complete loss of normal β-cell function by 16 weeks of age. Metabolic phenotyping of the POKO model has led to investigation of the structural and functional changes in the kidney and changes in blood pressure in these mice. Here we demonstrate that the POKO mouse is a model of renal disease that is accelerated by high levels of glucose and lipid accumulation. Similar to ob/ob mice, at 4 weeks of age these animals exhibited an increased urinary albumin:creatinine ratio and significantly increased blood pressure, but in contrast showed a significant increase in the renal hypertrophy index and an associated increase in p27(Kip1) expression compared with their obese littermates. Moreover, at 4 weeks of age POKO mice showed insulin resistance, an alteration of lipid metabolism and glomeruli damage associated with increased transforming growth factor beta (TGFβ) and parathyroid hormone-related protein (PTHrP) expression. At this age, levels of proinflammatory molecules, such as monocyte chemoattractant protein-1 (MCP-1), and fibrotic factors were also increased at the glomerular level compared with levels in ob/ob mice. At 12 weeks of age, renal damage was fully established. These data suggest an accelerated lesion through glucolipotoxic effects in the renal pathogenesis in POKO mice.


Figures

Fig. 1.
Fig. 1.
Incipient kidney renal injury in POKO mice at 4 weeks of age. (A) Representative immunoblot for p27Kip1 of renal protein from 4-week-old male WT, PPARγ2 KO, ob/ob and POKO mice. Levels were normalized to β-actin. Each value is the optical intensity of each band as a fold induction vs the WT control group (n=6). Fold induction is shown in graphic. *P<0.05 POKO vs ob/ob. (B) Total kidney mRNA levels of different genes from 4-week-old-male mice of each group. Data are means±s.e.m.; n=8–9 in each group; **P<0.01, ***P<0.001 POKO vs ob/ob; #P<0.05 POKO vs WT; $P<0.05 ob/ob vs WT. Normalized levels with BestKeeper (Bk).
Fig. 2.
Fig. 2.
Ultrastructural changes in the glomeruli of the POKO mice. (A) Transmission electron microscopy of glomeruli of 4-week-old POKO mice with broadening of foot processes (arrows). Foot processes in POKO mice are completely lost by 12 weeks (arrows). Original magnification: 20,000×. (B) GBM thickening in POKO mice when measuring the lamina densa (n=3–4). GBM thicknesses (white star in A) were measured across the whole GBM and across the lamina densa. Data are means±s.e.m.; n=6 in each group; ***P<0.001 POKO vs ob/ob; #P<0.05, ###P<0.001 POKO vs WT; $$P<0.01, $$$P<0.001 ob/ob vs WT.
Fig. 3.
Fig. 3.
Insulin resistance in POKO kidneys. (A) Total kidney mRNA levels of glucose metabolism genes from 4-week-old male WT, PPARγ2 KO, ob/ob and POKO mice. Data are means±s.e.m.; n=8–9. *P<0.05 POKO vs ob/ob; #P<0.05 POKO vs WT; $P<0.05 ob/ob vs WT; ϕP<0.05 PPARγ2 KO vs WT. Normalized levels with BestKeeper (Bk). (B) Representative immunoblot for pAKT(Ser473) from WT, ob/ob and POKO 4-week-old-male mice treated and non treated with insulin. Levels were normalized to total protein kinase B (AKTt). Each value is the relative optical intensity of each band normalized as a percentage of the saline-treated group. Values are represented in graphic (n=5–8). Data are means±s.e.m. *P<0.05 WT saline vs WT insulin. G6Pase, glucose 6-phosphatase; PEPCK, phosphoenolpyruvate carboxykinase; IRS, insulin receptor substrate.
Fig. 4.
Fig. 4.
Altered lipid metabolism in POKO kidneys. (A) Representative Oil-Red-O staining in the kidney from WT, PPARγ2 KO, ob/ob and POKO mice at 4 weeks. Original magnification: 400× (n=4). (B) Intraglomerular electron micrographs of ob/ob mice (12,000×) and POKO mice (15,000×) showing accumulation of lipid droplets (arrows). (C) Total kidney mRNA levels of lipid metabolism genes from 4-week-old male WT, PPARγ2 KO, ob/ob and POKO mice. Data are means±s.e.m.; n=8–9. *P<0.05, **P<0.01, ***P<0.001 POKO vs ob/ob; #P<0.05 POKO vs WT; ϕP<0.05 PPARγ2 KO vs WT. Normalized levels with BestKeeper (Bk).
Fig. 5.
Fig. 5.
Lipidomic profiling of kidney. (A) The heat map represents log(2) values of the data normalized with the mean of the WT genotype. Lipids with ANOVA P-values<0.05 are shown. 4-week-old male WT, PPARγ2 KO, ob/ob and POKO mice (n=7–8). (B) Differentially regulated lipids between POKO and ob/ob genotypes. P-values *P<0.05, **P<0.005. DG, diacylglycerol; Cer, ceramides; PC, phosphatidylcholine; PE, phosphatidylethanolamine.
Fig. 6.
Fig. 6.
Inflammation markers and renal injury in the four genotypes. (A) Immunostaining for MCP-1, TGFβ, PTHrP and type IV collagen in the kidney from male WT, PPARγ2 KO, ob/ob and POKO mice at 4 weeks (n=4–5). Original magnification: 400×; scale bars: 50 μm. (B) Representative immunoblot for cytosolic (CE) and nuclear (NE) p65 NFκB protein in renal extracts from WT, PPARγ2 KO, ob/ob and POKO 4-week-old male mice. Levels were normalized to β-actin in the cytosolic fraction and lamin-β receptor in the nuclear fraction. Each value is the relative optical intensity of each band normalized as a percentage of that of the WT group. Values are represented in graphic (n=5–7). Data are means±s.e.m. **P<0.01 POKO vs ob/ob; ##P<0.01 POKO vs WT; ΨP<0.05 POKO vs PPARγ2 KO.
Fig. 7.
Fig. 7.
Fibrotic markers in the progression of the renal disease in the POKO mice. Representative photomicrographs for PAS staining and Masson’s trichrome staining of kidney sections from male WT, PPARγ2 KO, ob/ob and POKO mice at 4 (A) and 12 (B) weeks. Glomerular fibrosis is shown (arrows) at different ages. Original magnification: 400×. n=4–5.

References

    1. Becker B., Kronenberg F., Kielstein J. T., Haller H., Morath C., Ritz E., Fliser D. (2005). Renal insulin resistance syndrome, adiponectin and cardiovascular events in patients with kidney disease: the mild and moderate kidney disease study. J. Am. Soc. Nephrol. 16, 1091–1098 - PubMed
    1. Bianchi S., Bigazzi R., Caiazza A., Campese V. M. (2003). A controlled, prospective study of the effects of atorvastatin on proteinuria and progression of kidney disease. Am. J. Kidney Dis. 41, 565–570 - PubMed
    1. Chavez J. A., Holland W. L., Bar J., Sandhoff K., Summers S. A. (2005). Acid ceramidase overexpression prevents the inhibitory effects of saturated fatty acids on insulin signaling. J. Biol. Chem. 280, 20148–20153 - PubMed
    1. Chou E., Suzuma I., Way K. J., Opland D., Clermont A. C., Naruse K., Suzuma K., Bowling N. L., Vlahos C. J., Aiello L. P., et al. (2002). Decreased cardiac expression of vascular endothelial growth factor and its receptors in insulin-resistant and diabetic states: a possible explanation for impaired collateral formation in cardiac tissue. Circulation 105, 373–379 - PubMed
    1. Chung B. H., Li C., Sun B. K., Lim S. W., Ahn K. O., Yang J. H., Choi Y. H., Yoon K. H., Sugawara A., Ito S., et al. (2005). Rosiglitazone protects against cyclosporine-induced pancreatic and renal injury in rats. Am. J. Transplant. 5, 1856–1867 - PubMed

Publication types

MeSH terms