. 2012 Sep;108(6):1752-63.
doi: 10.1152/jn.00177.2012. Epub 2012 Jul 5.

Sensitivity to prediction error in reach adaptation

Affiliations

Sensitivity to prediction error in reach adaptation

Mollie K Marko et al. J Neurophysiol. 2012 Sep.

Abstract

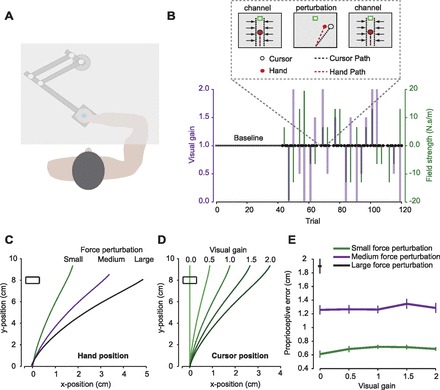
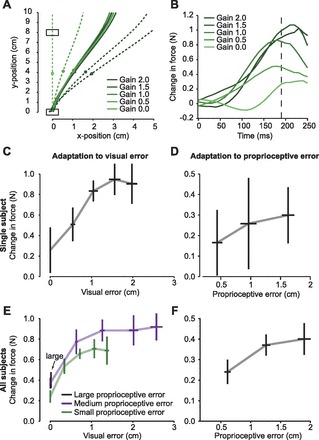
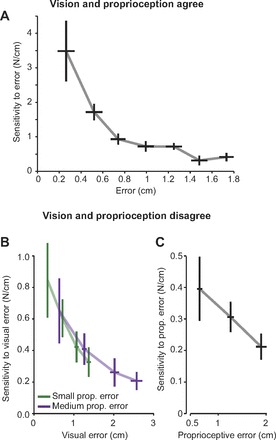
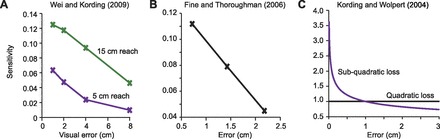
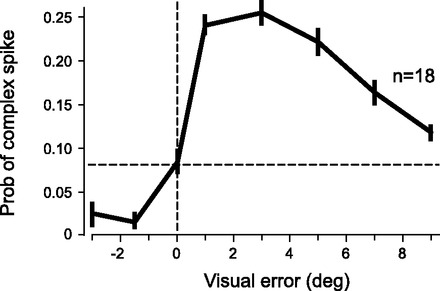
It has been proposed that the brain predicts the sensory consequences of a movement and compares it to the actual sensory feedback. When the two differ, an error signal is formed, driving adaptation. How does an error in one trial alter performance in the subsequent trial? Here we show that the sensitivity to error is not constant but declines as a function of error magnitude. That is, one learns relatively less from large errors compared with small errors. We performed an experiment in which humans made reaching movements and randomly experienced an error in both their visual and proprioceptive feedback. Proprioceptive errors were created with force fields, and visual errors were formed by perturbing the cursor trajectory to create a visual error that was smaller, the same size, or larger than the proprioceptive error. We measured single-trial adaptation and calculated sensitivity to error, i.e., the ratio of the trial-to-trial change in motor commands to error size. We found that for both sensory modalities sensitivity decreased with increasing error size. A reanalysis of a number of previously published psychophysical results also exhibited this feature. Finally, we asked how the brain might encode sensitivity to error. We reanalyzed previously published probabilities of cerebellar complex spikes (CSs) and found that this probability declined with increasing error size. From this we posit that a CS may be representative of the sensitivity to error, and not error itself, a hypothesis that may explain conflicting reports about CSs and their relationship to error.


Figures

Fig. 1.
Fig. 1.
Experimental setup. A: schematic of the experimental setup. Subjects held the handle of a robotic manipulandum and made horizontal reaching movements below an opaque screen. B: perturbation schedule. After a warm-up of 40 trials, subjects were presented with movement triplets in a random order separated by 0, 1, or 2 null field trials for 15 blocks (block 1 is shown). Triplets consisted of a channel trial (C1), one of the possible perturbations (P), and then a second channel trial (C2). Purple trace indicates the size of the visual perturbation, and green trace indicates the size of the proprioceptive perturbation. A channel trial, noted by the thick dark points, clamped the subject's error to 0 while measuring the force produced along the channel wall. The change in force from C1 to C2 measures the amount the subject learned from the error experienced in trial P. C: example of hand trajectories through the small, medium, and large rightward force perturbations. D: example of the cursor trajectory in each of the 5 possible gains as applied to the small proprioceptive error. Visual gains were applied to manipulate visual errors by scaling the lateral deviation of the hand by 1 of 5 values: 0.0, 0.5, 1.0, 1.5, or 2.0. Thus the gain 1.0 trace in this figure corresponds to the small proprioceptive error trace in C. E: proprioceptive error resulting from the 3 different-sized force fields: small, medium, and large. Error was measured as the lateral deviation at 190 ms. Proprioceptive error was consistent for a given field, despite the applied visual gain.
Fig. 2.
Fig. 2.
Adaptation tends to saturate as error size increases. A: hand trajectory (solid lines) and cursor trajectory (dashed lines) for a medium-size force perturbation for a representative subject. Circles indicate position at 190 ms from start of movement, which served as our proxy for measuring error. B: a channel trial preceded and followed each perturbation trial in A. This plot shows the change in force from the trial that preceded to the trial that followed the perturbation trial. The change in force represents how much the subject learned from the error in the preceding trial. This learning is small when the visual error is small (gain of 0.0), increases when visual error increases, but then saturates for large visual errors. Dashed line indicates 190 ms into the movement. C: change in force (measured at 190 ms) for the same representative subject across all 5 visual gains (0–2, sequentially from left to right) for the medium force perturbation. Error bars are SE. D: change in force (measured at 190 ms) for the 3 force perturbation sizes (small, medium, and large, from left to right) at 0 visual gain. Error bars are SE. E: group data: change in force as a function of visual error size. Each line represents a single force perturbation size, and each point represents a single visual gain on that proprioceptive error. Error bars are between-subject SE. F: change in force as a function of proprioceptive error size at 0 visual gain. Error bars are between-subject SE.
Fig. 3.
Fig. 3.
Sensitivity to error declines as error size increases. A: sensitivity to error when visual and proprioceptive modalities are matched. Sensitivity was calculated as described in Eq. 4. Movements from all subjects were binned, and bins with <20 movements were excluded. Bin size was 0.25 cm. Error bars represent SE for each bin. B: sensitivity to visual error as calculated via Eq. 6. Each point along each curve represents a different gain condition, increasing from a gain of 0.5 to 2.0 as visual error increases. The sensitivity declines with increasing visual error and appears independent of proprioceptive error, as evidenced by the fact that the 2 curves coincide. Error bars are between-subject SE. C: sensitivity to proprioceptive error, calculated via change in force in the zero visual gain condition for the small, medium, and large force perturbations. Error bars are between-subject SE.
Fig. 4.
Fig. 4.
Reanalysis of previously published psychophysical results. A: from Wei and Kording (2009). Adaptation to a visual shift perturbation of increasing size was measured as a change in reach direction in the next movement. There was no proprioceptive error. Sensitivity was calculated as adaptation divided by the visual perturbation for each reach distance, 15 cm and 5 cm. B: from Fine and Thoroughman (2006). Adaptation to force pulses of increasing magnitude was measured as the change in reach direction in the next movement. Sensitivity was calculated as this adaptation divided by error size. C: sensitivity to error as described by the loss function measured in Kording and Wolpert (2004). Subjects adjusted their hand position in a pea shooting task depending on the distribution of errors. From this, a loss function was calculated and found to be a subquadratic function of error. We calculated the sensitivity to error for each loss function, using Eq. 9.
Fig. 5.
Fig. 5.
Reanalysis of data from Soetedjo et al. (2008). This plot is a summary of n = 18 Purkinje cells in the cerebellum showing the probability of a complex spike in response to errors of various sizes.

References

    1. Albus JS. A theory of cerebellar function. Math Biosci 10: 25–61, 1971
    1. Bock O, Thomas M. Proprioception plays a different role for sensorimotor adaptation to different distortions. Hum Mov Sci 30: 415–423, 2011 - PubMed
    1. Burge J, Ernst MO, Banks MS. The statistical determinants of adaptation rate in human reaching. J Vis 8: 20.1.19415–20, 2008 - PMC - PubMed
    1. Catz N, Dicke PW, Thier P. Cerebellar complex spike firing is suitable to induce as well as to stabilize motor learning. Curr Biol 15: 2179–2189, 2005 - PubMed
    1. Cheng S, Sabes PN. Modeling sensorimotor learning with linear dynamical systems. Neural Comput 18: 760–793, 2006 - PMC - PubMed

Publication types

LinkOut - more resources