. 2012 Aug 31;287(36):30729-42.
doi: 10.1074/jbc.M112.374769. Epub 2012 Jul 7.

Contribution of the C-terminal regions of promyelocytic leukemia protein (PML) isoforms II and V to PML nuclear body formation

Affiliations

Contribution of the C-terminal regions of promyelocytic leukemia protein (PML) isoforms II and V to PML nuclear body formation

Yunyun Geng et al. J Biol Chem. .

Abstract

Promyelocytic leukemia protein (PML) nuclear bodies are dynamic and heterogeneous nuclear protein complexes implicated in various important functions, most notably tumor suppression. PML is the structural component of PML nuclear bodies and has several nuclear splice isoforms that share a common N-terminal region but differ in their C termini. Previous studies have suggested that the coiled-coil motif within the N-terminal region is sufficient for PML nuclear body formation by mediating homo/multi-dimerization of PML molecules. However, it has not been investigated whether any of the C-terminal variants of PML may contribute to PML body assembly. Here we report that the unique C-terminal domains of PML-II and PML-V can target to PML-NBs independent of their N-terminal region. Strikingly, both domains can form nuclear bodies in the absence of endogenous PML. The C-terminal domain of PML-II interacts transiently with unknown binding sites at PML nuclear bodies, whereas the C-terminal domain of PML-V exhibits hyperstable binding to PML bodies via homo-dimerization. This strong interaction is mediated by a putative α-helix in the C terminus of PML-V. Moreover, nuclear bodies assembled from the C-terminal domain of PML-V also recruit additional PML body components, including Daxx and Sp100. These observations establish the C-terminal domain of PML-V as an additional important contributor to the assembly mechanism(s) of PML bodies.


Figures
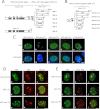
FIGURE 1.
FIGURE 1.
The C-terminal region of PML isoform II and V can target to PML-NBs independent of the shared N-terminal region. A and B, shown are schematic diagrams of PML isoforms (A) and GFP-nls-CT (1–5) proteins (B). C, H1299 cells were transfected with GFP-nls-CT (1–5) expression plasmids for 24 h. Images of transfected cells were taken by fluorescence microscopy. Cell nuclei were stained with DAPI. D and E, H1299 cells were transfected with GFP-nls-CT1, GFP-CT2, and GFP-nls-CT5 plasmids and stained with UBF (D) and PML (E) antibodies. Scale bar, 10 μm.
FIGURE 2.
FIGURE 2.
Critical region of CT2 is mapped for PML-NBs targeting. A, shown is a schematic diagram of the deletion mutants of GFP-CT2. The mapped PML-NB targeting region was indicated by a gray rectangle. B, H1299 cells were transfected with the plasmids encoding the deletion mutants of GFP-CT2 for 24 h. The localizations of these mutants were detected by GFP fluorescence, and cell nuclei were stained with DAPI. C, colocalization of GFP-CT2(651–690) with PML-NBs is shown. H1299 cells were transfected with the GFP-CT2(651–690) plasmid. After 24 h, PML-NBs were immunostained with a PML antibody. Endo. PML, endogenous PML. Scale bar, 10 μm.
FIGURE 3.
FIGURE 3.
Critical region of CT5 is mapped for PML-NBs targeting. A, shown is a schematic diagram of the deletion and point mutants of GFP-nls-CT5. The gray rectangle indicates the critical PML-NB targeting region of PML-V 599RLAL603RL. B, H1299 cells were transfected with the expression plasmids for GFP-nls-CT5 wild type or mutant proteins. 24 h later images were taken by fluorescence microscopy. Cell nuclei were stained with DAPI. Scale bar, 10 μm. C and D, H1299 cells were transfected with GFP-nls-CT5 and GFP-nls-CT5(R/P) plasmids (C) or full-length FLAG-PML-V and FLAG-PML-V(R/P) plasmids (D). 24 h later the cells were lysed and fractionated into the soluble and insoluble fractions. The distribution of the expressed proteins were analyzed by Western blot with the antibodies against GFP (C), and FLAG (D), α-tubulin (soluble fraction marker (S)), and HP-1 (insoluble fraction marker (IN)). R/P refers to GFP-nls-CT5 or FLAG-PML-V mutant in which Arg residues 599 and 603 of PML-V were mutated to prolines.
FIGURE 4.
FIGURE 4.
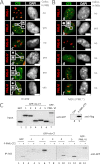
CT2 is mainly colocalized with PML II. A, H1299 were co-transfected with the expression plasmids for GFP-CT2 (CT2, green) and individual RFP-PML isoforms (PML-I to PML-VI, red). At 24 h after transfection, GFP, RFP, and DAPI signals were acquired by fluorescence microscopy. The left panel shows merged images of the red and green channels, and the right panels shows the DAPI signal in monochrome. Colocalization in nuclear bodies (Coloc. in NBs) was defined as full overlap of green and red dot-like structures in PML bodies. Insets in b and d–f show magnified monochrome views of the green and the red channels from areas containing a PML body (depicted by the white box). Scale bar, 10 μm. B, PML−/−MEFs were co-transfected with the expression plasmids for GFP-CT2 and individual FLAG-tagged PML isoforms (PML-I to PML-VI). At 24 h after transfection, FLAG-tagged PML isoforms were immunostained with an anti-PML antibody (red). The cells were then visualized and analyzed as described for A. The insets in b show magnified monochrome views of the green and the red channels from areas containing a PML body (depicted by the white box). Scale bar, 10 μm. C, FLAG-PML-CT2 and equal amounts of GFP, individual GFP-nls-CT (1–5), and GFP-PML-VI proteins were expressed in 293T cells. The cell extracts containing GFP or individual GFP fusion proteins were mixed with the fixed volumes of the cell extracts transfected with FLAG-PML-CT2 expression plasmid or the control empty FLAG vector plasmid. FLAG-PML-CT2-binding complex was immunoprecipitated (IP) with anti-FLAG M2 beads and analyzed by Western blot with anti-GFP and anti-FLAG antibodies.
FIGURE 5.
FIGURE 5.
The C-terminal region of PML V interacts with PML isoform IV and V. A, H1299 were co-transfected with the expression plasmids for GFP-nls-CT5 (green) and individual RFP-PML isoforms (PML-I to PML-VI, red). At 24 h after transfection, GFP, RFP, and DAPI signals were acquired by fluorescence microscopy. The left panel shows merged images of the red and green channels, and the right panels show the DAPI signal in monochrome. Colocalization in nuclear bodies (Coloc. in NBs) was defined as full overlap of green and red dot-like structures in PML bodies. Insets in c–e show magnified monochrome views of the green and the red channels from areas containing a PML body (depicted by the white box). Scale bar, 10 μm. B, PML−/−MEFs were co-transfected with the expression plasmids for GFP-nls-CT5 (green) and individual FLAG-PML isoforms as indicated. At 24 h after transfection, FLAG-PML isoforms (I to VI) were immunostained with an anti-PML antibody (red). The cells were then visualized and analyzed as described in A. Insets in d and e show magnified monochrome views of the green and the red channels from areas containing a PML body (depicted by the white box). Scale bar, 10 μm. C, PML-CT5 can interact with PML-CT3 to -CT5 as well as PML-VI in a direct yeast two-hybrid assay. PML-CT (1–5) and PML-VI were tested for interaction with PML-CT5. Growth of yeast was followed on control plates lacking tryptophan and leucine (double drop-out (DDO)) and plates additionally lacking histidine and adenine (double drop-out (QDO)). Growth on double drop-out is indicative for interaction. AD refers to the GAL activation domain; BD refers to the GAL DNA-binding domian.
FIGURE 6.
FIGURE 6.
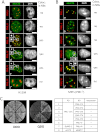
The C-terminal domain of PML-II exchanges rapidly at PML bodies independent of cotransfected full-length PML isoforms. A, FRAP was performed in circular regions containing a PML body in living HEp-2 cells co-expressing GFP-nls-CT2 and RFP-PML-II. Images show GFP and RFP fluorescence before (pre) and after (post) the 488-nm laser bleach pulse and at different time points later. Bar, 10 μm. B, FRAP of GFP-nls-CT2 fluorescence was quantitated from experiments as shown in A in the presence of overexpressed RFP-tagged full-length PML isoforms as indicated. Graphs show mean values (n ≥ 10). S.D. were less than 10%. RFI, relative fluorescence intensity.
FIGURE 7.
FIGURE 7.
The C-terminal domain of PML V stably binds to PML bodies. A, shown is a FRAP experiment of GFP-nls-CT5 (green) at PML bodies in HEp-2 cells coexpressing RFP-PML-V (red). B, shown is FRAP experiment of GFP-nls-CT5 (R/P) (green) at PML bodies in HEp-2 cells coexpressing RFP-PML-V (red). C, shown is quantitation of FRAP experiments of different fusion proteins as indicated in the legend below the graphs. D, FRAP of GFP-nls-CT5 in cells coexpressing RFP-PML-IV is shown. E, FRAP of GFP-nls-CT5 in cells coexpressing RFP-PML-V. F, shown is quantitation of FRAP of GFP-nls-CT5 fluorescence in the presence of overexpressed RFP-PML-IV (black curve) or RFP-PML-V (red curve). Graphs show medium values from FRAP experiments performed in at least 10 cells; S.D. is also shown in C. S.D. in F were less than 12%. RFI, relative fluorescence intensity. Bars, 10 μm.
FIGURE 8.
FIGURE 8.
Protein immobilization at PML bodies mediated by the C-terminal domain of PML V. A, shown is a schematic depiction of GFP-fusion proteins used for FRAP. GFP-PML-I and GFP-PML-II consist of GFP and the full-length coding sequences of PML-I and PML-II, respectively. GFP-PML-I-CT5 and GFP-PML-II-CT5 in addition contain the C-terminal domain (exon 7ab*) of PML isoform V at their C termini. B, shown is a FRAP experiment of GFP-PML-II and GFP-PML-II-CT5 at PML bodies in HEp-2 cells. C, shown is quantitation of FRAP experiments at PML bodies of GFP constructs as indicated in the legend below the graphs. Graphs show medium values from FRAP experiments performed in at least 10 cells. S.D. in were less than 12%. RFI, relative fluorescence intensity. Bar, 10 μm.
FIGURE 9.
FIGURE 9.
Transient interactions of the C-terminal domains of PML isoforms in chromatin. A–D, determination of the diffusion coefficient of GFP-nls-CT2 in the nucleus by RICS. In HEp-2 cells expressing GFP-nls-CT2 (A), a subregion with diffuse distribution of the fusion protein was selected for confocal imaging (B). For RICS, a time series of GFP fluorescence images (512 × 512 pixels) was acquired in this subregion of the nucleus as described under “Experimental Procedures” Subregions (64 × 64 pixels) within this time series were then extracted, and a correlation spectrum was assessed from these subregions (C). A diffusion coefficient map was generated as described under “Experimental Procedures” (D). E, RICS was performed for all GFP constructs shown (n = 10 cells each). The diffusion coefficient for free GFP in the nucleus as determined by RICS was DRICS = 23 ± 6 μm2s−1. The theoretical diffusion coefficient (Dtheor) of the GFP-CT constructs was determined considering their increased molecular weight compared with free GFP (hatched bars). Note that the apparent diffusion coefficients of all GFP-CT fusion proteins as determined by RICS are considerably smaller than their theoretical values in the nucleus.
FIGURE 10.
FIGURE 10.
The C-terminal region of PML V forms NBs independent of endogenous PML that can recruit multiple PML-NB associated proteins. A, PML−/− MEFs were transfected with GFP-nls-CT (1–5) expression plasmids for 24 h. Images of transfected cells were taken by fluorescence microscopy. Cell nuclei were stained with DAPI. B and C, PML−/− MEFs were co-transfected with expression plasmids for GFP-nls, GFP-nls-CT5, and GFP-nls-CT2 alone or together with FLAG-Daxx (B) or RFP-Sp100 (C) plasmids. Images were taken by fluorescence microscopy. FLAG-Daxx was immunostained with an anti-FLAG antibody (B). RFP-Sp100 was detected by RFP fluorescence (C); co-localization was shown in yellow in the merge pictures. D, shown is a schematic diagram of PML-IV-m6 and PML-VI-m6 (top panel); Asterisks indicate point mutation. PML−/− MEFs were transfected with expression plasmids for FLAG-PML-IV-m6 and FLAG-PML-VI-m6 alone or together with GFP-nls-CT5. GFP-nls-CT5 was detected by the GFP fluorescence; FLAG-PML-IV-m6 and FLAG-PML-VI-m6 were immunostained with an anti-PML antibody. Colocalization is shown in yellow in the merge pictures. Scale bar, 10 μm.

References

    1. Everett R. D., Lomonte P., Sternsdorf T., van Driel R., Orr A. (1999) Cell cycle regulation of PML modification and ND10 composition. J. Cell Sci. 112, 4581–4588 - PubMed
    1. Salomoni P., Pandolfi P. P. (2002) The role of PML in tumor suppression. Cell 108, 165–170 - PubMed
    1. Zhong S., Salomoni P., Pandolfi P. P. (2000) The transcriptional role of PML and the nuclear body. Nat. Cell Biol. 2, E85–E90 - PubMed
    1. Bischof O., Kirsh O., Pearson M., Itahana K., Pelicci P. G., Dejean A. (2002) Deconstructing PML-induced premature senescence. EMBO J. 21, 3358–3369 - PMC - PubMed
    1. Regad T., Chelbi-Alix M. K. (2001) Role and fate of PML nuclear bodies in response to interferon and viral infections. Oncogene 20, 7274–7286 - PubMed

Publication types

MeSH terms