Identification of Potential Glycoprotein Biomarkers in Estrogen Receptor Positive (ER+) and Negative (ER-) Human Breast Cancer Tissues by LC-LTQ/FT-ICR Mass Spectrometry
- PMID: 22773931
- PMCID: PMC3390597
- DOI: 10.7150/jca.4592
Identification of Potential Glycoprotein Biomarkers in Estrogen Receptor Positive (ER+) and Negative (ER-) Human Breast Cancer Tissues by LC-LTQ/FT-ICR Mass Spectrometry
Abstract
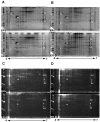
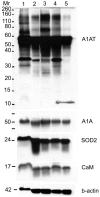
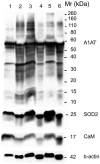
Breast cancer is the second most fatal cancer in American women. To increase the life expectancy of patients with breast cancer new diagnostic and prognostic biomarkers and drug targets must be identified. A change in the glycosylation on a glycoprotein often causes a change in the function of that glycoprotein; such a phenomenon is correlated with cancerous transformation. Thus, glycoproteins in human breast cancer estrogen receptor positive (ER+) tissues and those in the more advanced stage of breast cancer, estrogen receptor negative (ER-) tissues, were compared. Glycoproteins showing differences in glycosylation were examined by 2-dimensional gel electrophoresis with double staining (glyco- and total protein staining) and identified by reversed-phase nano-liquid chromatography coupled with a hybrid linear quadrupole ion trap/ Fourier transform ion cyclotron resonance mass spectrometer. Among the identified glycosylated proteins are alpha 1 acid glycoprotein, alpha-1-antitrypsin, calmodulin, and superoxide dismutase mitochondrial precursor that were further verified by Western blotting for both ER+ and ER- human breast tissues. Results show the presence of a possible glycosylation difference in alpha-1-antitrypsin, a potential tumor-derived biomarker for breast cancer progression, which was expressed highest in the ER- samples.
Keywords: Alpha-1-antitrypsin; Biomarkers; Estrogen receptor positive and negative breast cancer; Fourier transform ion cyclotron resonance mass spectrometry; Proteomics; Two-dimensional gel electrophoresis.
Conflict of interest statement
Competing Interests: The authors have declared that no competing interest exists.
Figures


Similar articles
-
Differential phosphopeptide expression in a benign breast tissue, and triple-negative primary and metastatic breast cancer tissues from the same African-American woman by LC-LTQ/FT-ICR mass spectrometry.Biochem Biophys Res Commun. 2011 Aug 19;412(1):127-31. doi: 10.1016/j.bbrc.2011.07.057. Epub 2011 Jul 23. Biochem Biophys Res Commun. 2011. PMID: 21802409
-
Screening of synthetic PDE-5 inhibitors and their analogues as adulterants: analytical techniques and challenges.J Pharm Biomed Anal. 2014 Jan;87:176-90. doi: 10.1016/j.jpba.2013.04.037. Epub 2013 May 6. J Pharm Biomed Anal. 2014. PMID: 23721687 Review.
-
Novel stromal biomarkers in human breast cancer tissues provide evidence for the more malignant phenotype of estrogen receptor-negative tumors.J Biomed Biotechnol. 2011;2011:723650. doi: 10.1155/2011/723650. Epub 2011 Oct 3. J Biomed Biotechnol. 2011. PMID: 21976967 Free PMC article.
-
Profiling of N-acyl-homoserine lactones by liquid chromatography coupled with electrospray ionization and a hybrid quadrupole linear ion-trap and Fourier-transform ion-cyclotron-resonance mass spectrometry (LC-ESI-LTQ-FTICR-MS).J Mass Spectrom. 2008 Jan;43(1):82-96. doi: 10.1002/jms.1275. J Mass Spectrom. 2008. PMID: 17708516
-
Androgen glucuronides analysis by liquid chromatography tandem-mass spectrometry: could it raise new perspectives in the diagnostic field of hormone-dependent malignancies?J Chromatogr B Analyt Technol Biomed Life Sci. 2013 Dec 1;940:24-34. doi: 10.1016/j.jchromb.2013.09.022. Epub 2013 Sep 27. J Chromatogr B Analyt Technol Biomed Life Sci. 2013. PMID: 24140653 Review.
Cited by
-
Proteomic Analysis of Urine to Identify Breast Cancer Biomarker Candidates Using a Label-Free LC-MS/MS Approach.PLoS One. 2015 Nov 6;10(11):e0141876. doi: 10.1371/journal.pone.0141876. eCollection 2015. PLoS One. 2015. PMID: 26544852 Free PMC article.
-
Identification of potential glycoprotein biomarkers in oral squamous cell carcinoma using sweet strategies.Glycoconj J. 2021 Feb;38(1):1-11. doi: 10.1007/s10719-021-09973-z. Epub 2021 Feb 6. Glycoconj J. 2021. PMID: 33547992
-
Altered glycosylation in cancer: A promising target for biomarkers and therapeutics.Biochim Biophys Acta Rev Cancer. 2021 Jan;1875(1):188464. doi: 10.1016/j.bbcan.2020.188464. Epub 2020 Nov 4. Biochim Biophys Acta Rev Cancer. 2021. PMID: 33157161 Free PMC article. Review.
-
Lectin histochemistry reveals SNA as a prognostic carbohydrate-dependent probe for invasive ductal carcinoma of the breast: a clinicopathological and immunohistochemical auxiliary tool.Int J Clin Exp Pathol. 2014 Apr 15;7(5):2337-49. eCollection 2014. Int J Clin Exp Pathol. 2014. PMID: 24966944 Free PMC article.
References
-
- Siegel R, Naishadham D, Jemal A. Cancer statistics, 2012. CA Cancer J Clin. 2012;62:10–29. - PubMed
-
- Yousefi M, Mattu R, Gao CL, Man YG. Mammary ducts with and without focal myoepithelial cell layer disruptions show a different frequency of white blood cell infiltration and growth pattern: Implications for tumor progression and invasion. Appl Immunohisto M M. 2005;13:30–7. - PubMed
-
- Man YG, Shekitka KM, Bratthauer GL, Tavassoli FA. Immunohistochemical and genetic alterations in mammary epithelial cells immediately overlying focally disrupted myoepithelial cell layers. Breast Cancer Res Treat. 2002;76:S143–S.
LinkOut - more resources
Full Text Sources

