. 2012 Jul;119(3):573-616.
doi: 10.1037/a0028681.

Generalization through the recurrent interaction of episodic memories: a model of the hippocampal system

Affiliations
Free PMC article

Generalization through the recurrent interaction of episodic memories: a model of the hippocampal system

Dharshan Kumaran et al. Psychol Rev. 2012 Jul.
Free PMC article

Abstract

In this article, we present a perspective on the role of the hippocampal system in generalization, instantiated in a computational model called REMERGE (recurrency and episodic memory results in generalization). We expose a fundamental, but neglected, tension between prevailing computational theories that emphasize the function of the hippocampus in pattern separation (Marr, 1971; McClelland, McNaughton, & O'Reilly, 1995), and empirical support for its role in generalization and flexible relational memory (Cohen & Eichenbaum, 1993; Eichenbaum, 1999). Our account provides a means by which to resolve this conflict, by demonstrating that the basic representational scheme envisioned by complementary learning systems theory (McClelland et al., 1995), which relies upon orthogonalized codes in the hippocampus, is compatible with efficient generalization-as long as there is recurrence rather than unidirectional flow within the hippocampal circuit or, more widely, between the hippocampus and neocortex. We propose that recurrent similarity computation, a process that facilitates the discovery of higher-order relationships between a set of related experiences, expands the scope of classical exemplar-based models of memory (e.g., Nosofsky, 1984) and allows the hippocampus to support generalization through interactions that unfold within a dynamically created memory space.


Figures

Figure 1
Figure 1. Schematic of model architecture, as used in transitive inference task. Basic two-layer network (feature, conjunctive) connected bidirectionally and used in all simulations. Curved arrow indicates application of hedged softmax function to the conjunctive layer, which includes the C parameter regulating overall activity. Response layer included in model architecture in simulations of transitive inference, paired associate inference, and acquired equivalence tasks. For the transitive inference task, units in feature layers denote stimuli A–F; units in conjunctive layer correspond to the five trained stimulus pairings (i.e., AB, BC, CD, DE, EF); units in the response layer correspond to the network's choice (i.e., A–F). The conjunctive layer connected with the response layer through unidirectional excitatory and inhibitory connections—for example, the AB conjunctive unit excited the A response unit and inhibited the B response unit. External input presented to the feature layer. For details of the model architecture used in specific simulations, see the main text.
Figure 2
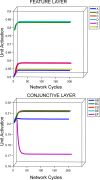
Figure 2. Illustration of the capacity of REMERGE (recurrency and episodic memory results in generalization) to exhibit the phenomenon of transitivity: simulated BD (top) and BE (middle) inference trials shown with network weights coding for premise pairs set to a value of 1.0; temperature parameter, τ, set to 0.25, C constant set to 1. Network performance during a simulated premise trial (BC) shown below with same parameters. Timecourse of network activity (y-axis: unit activation plotted in arbitrary units), across 300 cycles (x-axis). See the main text for details.
Figure 3
Figure 3. Illustration of the capacity of an interactive activation model (IAC) to exhibit the phenomenon of transitivity: Simulated B–D inference trial with network weights coding for premise pairs set to a value of 1.0; lateral inhibition set to –1 in conjunctive and response layers. Timecourse of network activity (y-axis: unit activation plotted in arbitrary units), across 300 cycles (x-axis). See the main text for details.
Figure 4
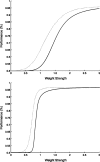
Figure 4. Simulating the emergence of a capacity for transitivity by increasing the strength of connection weights coding premise pairs. Performance (y-axis; Luce choice ratios expressed as a %) in premise pair trials (averaged across all pairs: dotted line), inference trials (averaged across close and distant inference pairs: solid line) plotted as a function of network weight strength. Lag generalization effect evident, whereby inferential performance at each weight strength is lower than performance on premise pairs. The magnitude of this effect is controlled by the temperature parameter, where relatively high values produce a smaller lag generalization effect (upper panel; parameters: τ = 0.45; C = 5; β = 0.3), and relatively lower values produce a greater lag generalization effect (lower panel; parameters: τ = 0.2; C = 5; β = 0.3).
Figure 5
Figure 5. Transitive inference task: Illustration of failure of network to perform inference at lower weights strengths (w = 0.3) due to lack of graded pattern of activity over conjunctive and feature layers: τ = 0.25; C = 1. Note similar activities of units in the conjunctive layer (cf. performance of network with w = 1 illustrated in Figure 2).
Figure 6
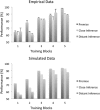
Figure 6. Empirical (upper panel) and simulated data (lower panel) relating to the young subject group of the transitive inference experiment reported in Moses et al. (2006). Performance (y-axis; %) in premise pair trials (averaged across all pairs: dark gray bars), close inference pairs (light gray bars: B–D and C–E trials), and distant inference trials (medium gray bars: B–E trials) across five blocks of the experiment (x-axis). Parameters: τ = 0.45; C = 5; β = 0.3. Weight strengths for the five simulated blocks: 1.17, 1.32, 1.77, 2.09, 2.32. Error bars (empirical data) reflect standard errors of the mean. Model performance (expressed as % correct) derived directly from Luce choice ratios.
Figure 7
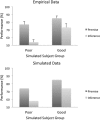
Figure 7. Empirical (upper panel) and simulated data (lower panel) relating to the behavioral findings reported in the paired associate inference experiment by Zeithamova and Preston (2010). Performance (y-axis; %) in premise pair trials (averaged across all pairs; e.g., A: B+ Y−: light gray bars), inference pairs (medium gray bars: e.g., A: C+ Z−) for “poor” and “good” subject groups (x-axis). Parameters: τ = 0.4; C = 15; β = 0.15, Weight strengths for poor and good groups, respectively: 1.47, 1.52. Error bars (empirical data) reflect standard errors of the mean. Model performance (expressed as % correct) derived directly from Luce choice ratios.
Figure 8
Figure 8. Empirical and simulated data relating to the functional magnetic resonance imaging (fMRI) findings observed in the paired associate inference experiment reported in Zeithamova and Preston (2010). Upper panel (empirical data): Hippocampal activity (y-axis: % fMRI BOLD signal change) shown for different types of encoding (premise) trials (AB and BC), as a function of whether generalization in subsequent AC transfer trial during the test phase was unsuccessful (AC incorrect: dark gray bar) or successful (AC correct: light gray bar). Significantly greater activation was observed during BC (but not AB) trials when subsequent AC trials were correct, compared to incorrect. Right panel (simulated data): Activity in the conjunctive layer (y-axis: arbitrary units) within the network shown for AB and BC encoding trials, at different network weight strengths (w = 1.47 and w = 1.52, for AC incorrect and AC correct trials, respectively). Light gray part of bar denotes activity of AB conjunctive unit, and dark gray part denotes activity of BC unit. Other parameters set as in behavioral simulation of poor and good performing groups—that is, τ = 0.4; C = 15; β = 0.15. Data are taken from individual simulated trials, at different weight strengths. See the main text for details.
Figure 9
Figure 9. Schematic of model architecture, as used in the paired associative inference task. For the purposes of the simulation, two sets of paired associates were employed: The feature layer comprised six units denoting individual objects (A, B, C, X, Y, Z). The conjunctive layer comprised four units coding for premise pairs learnt during training (i.e., AB, BC, XY, YZ). Curved arrow indicates application of the hedged softmax function to this layer, including C parameter, which regulates the overall level of activity. Bidirectional excitatory connections were present between feature layer and conjunctive layer. Unidirectional excitatory connections were present between the conjunctive and response layer; the latter denoting the four objects that could be chosen during a given test trial (i.e., B, C, Y, Z). For further details, see the main text.
Figure 10
Figure 10. Acquired equivalence task: Empirical data from Shohamy and Wagner (2008). Top left panel: performance (y-axis; %) shown for poor (left) and good generalizer groups (right) (x-axis). Premise performance (dark gray bar) reflects average across all premise trials. Generalization performance (light gray bar) relates to a F2–S2 trial. While premise pair performance was near ceiling in both poor and good groups (~90%), generalization performance was far superior in the good group (∼90% vs. ∼60%). Bottom left panel: significant correlation (r ∼0.5) between percentage change in left hippocampal BOLD signal between early and late phases of premise pair training (y-axis) and generalization performance (x-axis). Note that the actual percentage signal change magnitudes are not relevant in the current context and, therefore, are omitted for ease of interpretation. Bottom right panel illustrates that as a group, the good generalizers showed a significant increase in hippocampal activation between early and late phases of training, compared to the poor generalizers. Top right panel shows the relevant region of the left hippocampus, significant at a threshold of p < .05 (corrected for the volume of the hippocampus). Adapted with permission from “Integrating Memories in the Human Brain: Hippocampal-Midbrain Encoding of Overlapping Events,” by D. Shohamy and A. D. Wagner, 2008Neuron, 60
Figure 11
Figure 11. Acquired equivalence task: Shohamy and Wagner (2008). Simulated data. Top left panel: Simulation of behavioral data—performance (y-axis, Luce choice ratios expressed as a percentage) shown for poor (left) and good (right) generalizer groups (x-axis). Premise performance (dark gray bar) reflects average across all premise trials. While premise pair performance was significantly better in the good group, compared to the poor group, it was near ceiling in both the poor and good groups (c90%). Generalization performance (light gray bar) in contrast was far superior in the good group. Parameters: τ = 0.4; C = 10; β = 0.1. Weight strengths for poor and good groups, respectively: 1.31, 1.82. Bottom left panel: illustration of relationship between network weight strength (x-axis), premise performance (light gray line; averaged across all premise pairs), and generalization performance (dark gray line). Top right panel: Neural data. Simulation of empirical finding of a greater increase in hippocampal activity between early and late phases of training (shown in bottom right panel), in good generalizer group, during F2–S1 trial. Network parameters (τ = 0.4; C = 10) were fixed at the values used to simulate the behavioral data. Poor (dark gray bar) and good groups (light gray bar) are simulated by similar average weight strengths during the early training phase, in line with the observation that performance on premise pairs was similar in both groups (at around 70% level). In the late phase of training, good group was simulated by a network weight strength of 1.82, and poor group by a weight strength of 1.31, as in the simulation of behavioral performance. Bottom right panel: illustration of the relationship between network weight strength (x-axis) and activity in the conjunctive layer during an F2–S1 trial (y-axis; arbitrary units). Black line shows overall activity within conjunctive layer, medium gray line shows activity of the F2–S1 conjunctive unit, and light gray line shows summed activity of the F1–S1 and F1–S2 conjunctive units. Dashed vertical lines indicate simulated weight strength of the poor and good groups during late phase of training. Network parameters (τ = 0.4; C = 10) were fixed at the values used to simulate the behavioral data. Difference in conjunctive activity between the poor and good groups during the late phase of training is due primarily to the increase in direct activation of the F2–S1 unit (see the main text for details).
Figure 12
Figure 12. Empirical (upper panels) and simulated (lower panels) data relating to the experiment by Knowlton and Squire (1993). Performance (%) shown on y-axis and indexes probability of endorsing a test item as a category member (categorization task) or judging an item as old (recognition task). Dark gray bars = control group; light gray bars = amnesic group. Left panels show dissociation between relatively spared overall categorization performance (i.e., across all test pattern types) and impaired recognition performance. Right panels show endorsement probability for each test item type in the categorization task, illustrating prototypicality effect. Performance in the empirical study is collapsed across high and low distortions and was simulated by 1 distortion level (see the main text for details). Parameter settings for the simulation were as follows: control group (weight strength = 1.50, Ccategorization = 970, Crecognition = 700) and the amnesic group (weight strength = 0.83, Ccategorization = 70, Crecognition = 30), where C is the regulatory parameter entering into the hedged softmax function applied to the conjunctive layer. C was set at a level that ensured unbiased responding (i.e., equal numbers of hits and correct rejections). Temperature was fixed at 1 throughout the simulation.
Figure 13
Figure 13. Simulated data relating to the experiment by Knowlton and Squire (1993)x-axis) and network performance on categorization (solid line) and recognition task (dashed line). Vertical dashed lines indicate weight strength used to simulate the performance of the group of amnesic and normal subjects. See the main text for details.
Figure 14
Figure 14. Illustration of replay activity in rodent hippocampus reflecting shortcut sequences (across the top of the maze), and a schematic of maze environment. Adapted with permission from “Hippocampal Replay Is Not a Simple Function of Experience,” by A. S. Gupta, M. A. van der Meer, D. S. Touretzky, and A. D. Redish, 2010Neuron, 65Gupta et al., 2010
Figure 15
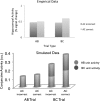
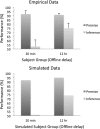
Figure 15. Transitive inference task: empirical (upper panel) and simulated (lower panel) data from Ellenbogen et al.'s (2007) study. Performance of 20-min and 12-hr subject groups shown (x-axis) with performance (%) on y-axis. Groups differ as a function of the length and nature of the delay period interposed between training and testing. Premise performance (dark gray bar) averaged across all relevant pairs (i.e., A–B, B–C, … E–F). Inference performance (light gray bar) averaged over close (B–D, C–E) and distant inference (B–E) pairs. Parameters: τ = 0.2; C = 15; β = 0.3. Weight strengths for the 20-min and 12-hr groups, respectively: 1.29, 1.35. Error bars (empirical data) reflect standard error. Model performance (expressed as percentage correct) derived directly from Luce choice ratios (see the main text for details).
Figure 16
Figure 16. Transitive inference task: Illustration showing that the network no longer favors B over E in a BE trial, following the addition of the F+ A− premise pair to the existing set of premise pairs—which effectively transforms the linear hierarchical arrangement of stimuli into a circular configuration (see the main text for details). Parameters: τ = 0.25; C = 1. Weight strength = 1 (i.e., as in simulation shown in Figure 2).
Figure A1
Figure A1. The 5–4 category learning task: probability of assigning each of 16 test stimuli (x-axis) to Category A (y-axis) according to the generalized context model (GCM; dotted line) and REMERGE (recurrency, and episodic memory results in generalization; solid line). Data relating to GCM are drawn from the intermediate setting of the sensitivity parameter (i.e., 5), described in Nosofsky (2000). Parameters in REMERGE include the following: τ = 0.65; C = 1; β = 0.25. Note that REMERGE also provides an adequate fit to empirical data summarized in a meta-analysis of 30 empirical studies (J. D. Smith & Minda, 2000; though see Nosofsky, 2000Table A1 in the Appendix for a description of the 5–4 category structure.
Figure A2
Figure A2. Recognition memory simulation: performance of recurrent and feedforward network, indexed by measure of signal strength (d-prime) based on difference in feature layer activity for studied and lure items, shown for network temperatures across the range 0.1 to 2.0 (in increments of 0.1). Note the relatively similar performance of recurrent and feedforward networks, across a relatively large range of network temperatures. See the main text for details.

References

    1. Amaral D. G., & Lavenex P. (2006). Hippocampal neuroanatomy. In Bliss T., Andersen P., Amaral D. G., Morris R. G., & O'Keefe J. (Eds.), The hippocampus book (pp. 37–115). Oxford, England: Oxford University Press.
    1. Ashby F. G., & Maddox W. T. (2005). Human category learning. Annual Review of Psychology, 56, 149–178. doi:10.1146/annurev.psych.56.091103.070217 - PubMed
    1. Bartlett F. C. (1932). Remembering: An experimental and social study. Cambridge, England: Cambridge University Press.
    1. Becker S. (2005). A computational principle for hippocampal learning and neurogenesis. Hippocampus, 15, 722–738. doi:10.1002/hipo.20095 - PubMed
    1. Bowers J. S. (2009). On the biological plausibility of grandmother cells: Implications for neural network theories in psychology and neuroscience. Psychological Review, 116, 220–251. doi:10.1037/a0014462 - PubMed

Publication types