. 2012 Oct;33(5):1156-69.
doi: 10.1016/j.neuro.2012.06.009. Epub 2012 Jul 7.

Whole genome expression profile in neuroblastoma cells exposed to 1-methyl-4-phenylpyridine

Affiliations

Whole genome expression profile in neuroblastoma cells exposed to 1-methyl-4-phenylpyridine

E Mazzio et al. Neurotoxicology. 2012 Oct.

Abstract

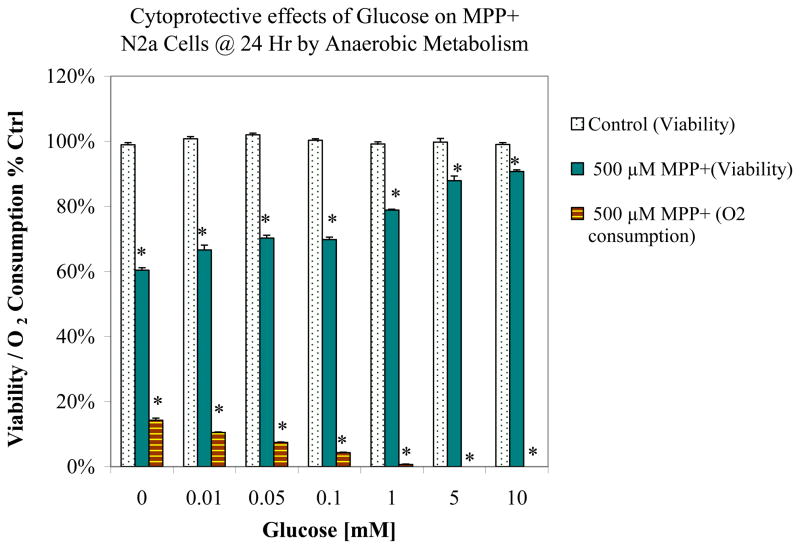
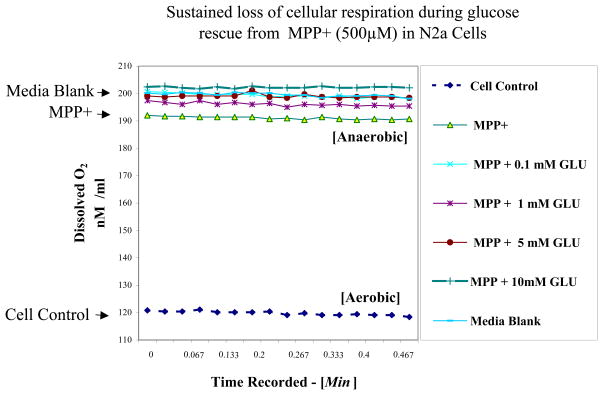
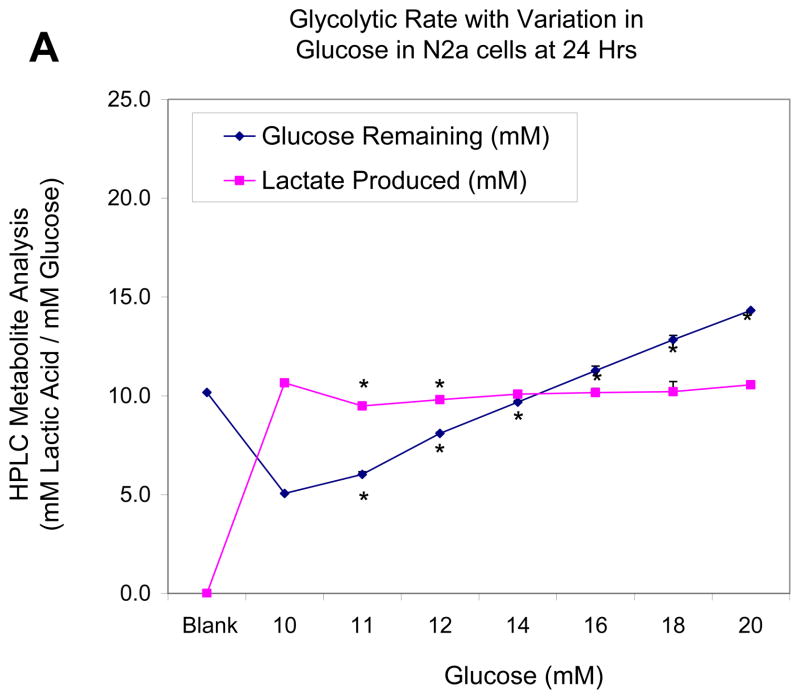
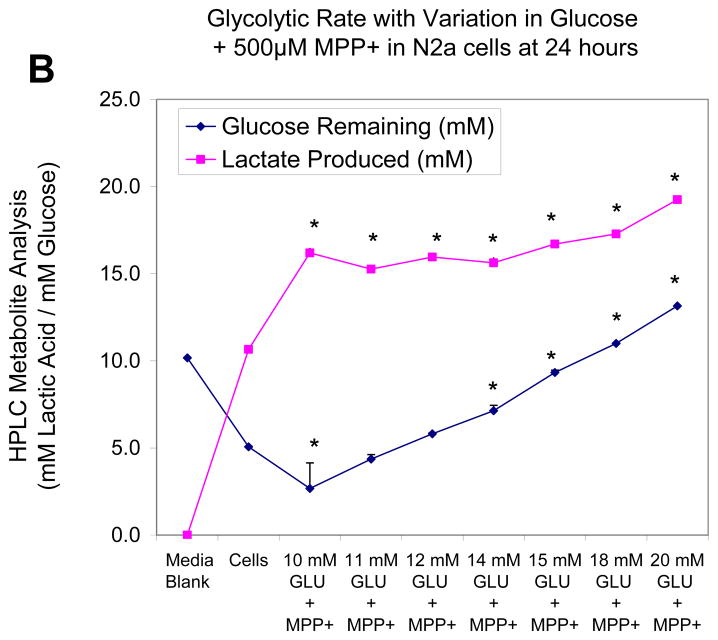
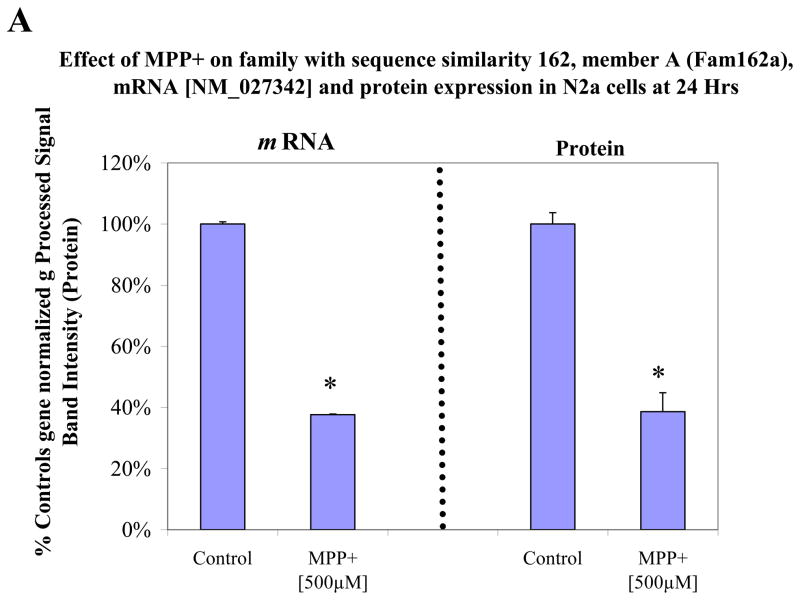
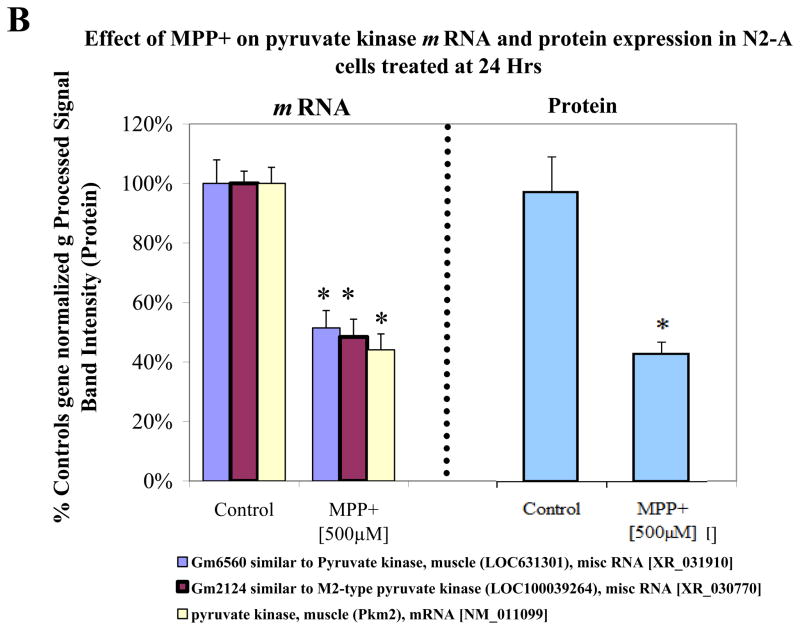
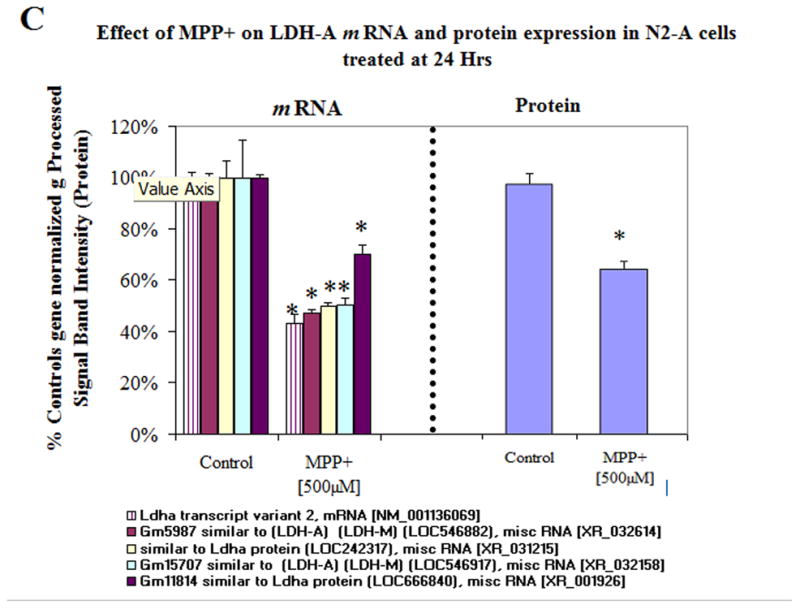
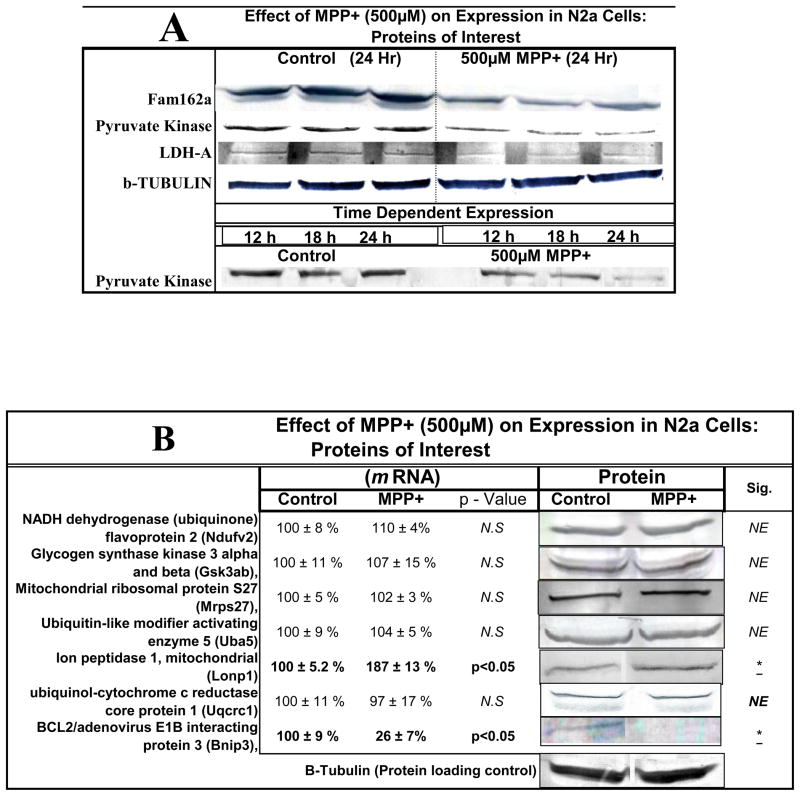
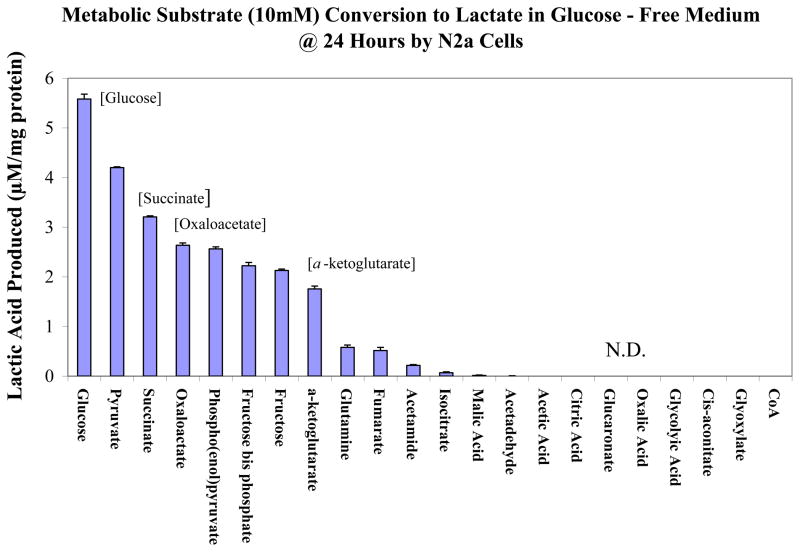
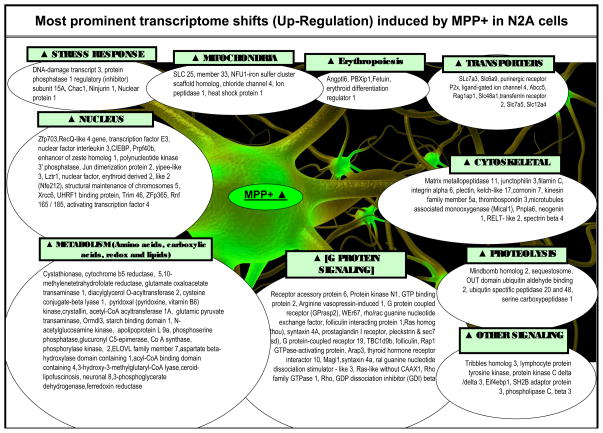
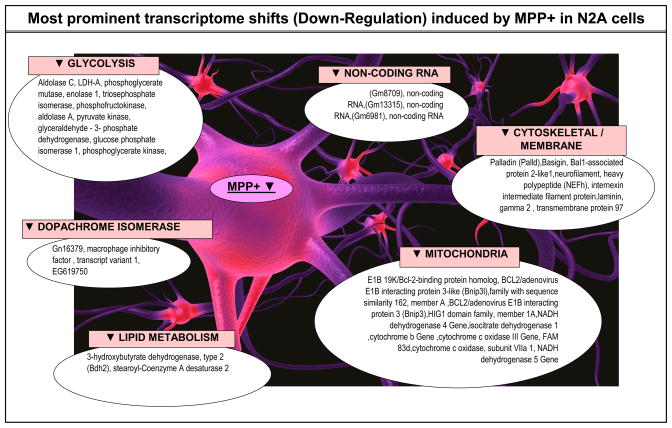
Mitochondrial dysfunction and subsequent energy failure is a contributing factor to degeneration of the substantia nigra pars compacta associated with Parkinson's disease (PD). In this study, we investigate molecular events triggered by cell exposure to the mitochondrial toxin 1-methyl-4-phenylpyridine (MPP+) using whole genome-expression microarray, Western Blot and metabolic studies. The data show that MPP+ (500 μM) obstructs mitochondrial respiration/oxidative phosphorylation (OXPHOS) in mouse neuroblastoma Neuro-2a cells, juxtaposing accelerated glucose consumption and production of lactic acid. While additional glucose concentrations restored viability in the presence of MPP+ (500 μM), the loss of OXPHOS was sustained, suggesting that compensatory anaerobic metabolic systems were fulfilling required energy needs. Under these conditions, MPP+ initiated significant changes to the transcription of 439 genes of which 287 DAVID IDs were identified and subsequent functional annotation clusters identified. Prominent changes were as follows; MPP+ initiated loss of mRNA for mitochondrial encoded 3-hydroxybutyratedehydrogenase, type 2(Bdh2), tv1, NADH dehydrogenase 4,5 genes, cytochrome b and NADH dehydrogenase (ubiquinone) flavoprotein 3, concomitant to rise in a mitochondrial fission gene; ganglioside-induced differentiation-associated-protein 1 (GDAP1). The negative changes to OXPHOS components were accompanied by protective forces within the mitochondria espousing elevated ratio of anti/pro-apoptotic processes. These included a loss of apoptotic Bcl-2/adenovirus E1B 19-kDa-interacting protein (BNIP3) and family with sequence similarity 162, member A (FAM162a) and rise of heat shock protein 1 and Lon peptidase 1. There were no changes indicative of free radical damage (e.g. SOD, GSH-Px), rather MPP+ initiated significant elevation in G protein signaling components (which trigger catabolic processes) and anaerobic metabolic systems involving carboxylic acid/transamination reactions (e.g. glutamate oxaloacetate transaminase 1 (GOT1), glutamic pyruvate-alanine transaminase 2 (GPT2), cystathionase and redox proteins such as cytochrome b5 reductase 1 and ferredoxin reductase. Counter-intuitively, the data show reduction of mRNA in glycolytic processes [DAVID enrichment score 9.96 p value 1.90E-19], some corroborated by Western Blot, bringing in to question the sources of lactate observed in the presence of MPP+. Examining this aspect, the data show that diverse carboxylic acids (succinate, oxaloacetate and a-ketoglutarate) are capable of contributing to the lactate pool in addition to phosph(enolpyruvate) or pyruvate in the absence of glucose by this cell line. In conclusion, these findings show that MPP+ negatively affects the transcriptome involved with complex I, but initiated an elevation of G protein signaling and anaerobic metabolic systems involved with nitrogen/carboxylic acid metabolism. Future research will be required to elucidate the survival pathways that drive anaerobic substrate level phosphorylation, and define functional ramification to the loss of mitochondrial FAM162a and BNIP3 proteins.


Figures

Figure 1
Figure 1
Supplemental glucose protection (.01–10mM) against the toxicity and loss of OXPHOS induced by 500μM MPP+ in N2a cells after 24 Hr cultured in baseline low glucose DMEM (1000mg/L). The data represents cell viability and O2 consumption as % control. Data are presented as the Mean ± S.E.M., n=4. Significance of difference between the control vs. treatment groups were determined by a one–way ANOVA followed by a Tukey post hoc test * p<0.05.
Figure 2
Figure 2
Oxygen electrode raw data chart recording of dissolved O2 in the media matrix blank vs. N2a cell supernatant ± [MPP+ 500 μM] with variation in additional glucose (0.1 –10 mM) in low glucose DMEM (1000 mg /L). The data represent dissolved O2 (nM / ml at 37.5°C) in one sample set, and all groups were statistically different from cell controls determined by a one–way ANOVA followed by a Tukey post hoc test n=4 * p<0.05.
Figure 3
Figure 3
Figure 3A. Effects of elevating concentration of glucose on glucose to lactate conversion in N2a cells at 24 Hr. The data represent lactic acid produced (mM) and glucose remaining (mM) [non-utilized glucose] and are presented as the Mean ± S.E.M. n=4. Significance of difference between the cell control vs., treatment groups were determined by a one–way ANOVA followed by a Tukey post hoc test * p<0.05. Figure 3B. Effects of elevating concentration of glucose on glucose to lactate conversion in N2a cells treated with MPP+ [500 μM] at 24 Hr. The data represent lactic acid produced (mM) and glucose remaining (mM) [non-utilized glucose] and are presented as the Mean ± S.E.M. n=4. Significance of difference between the cell control vs. treatment groups were determined by a one–way ANOVA followed by a Tukey post hoc test * p<0.05.
Figure 3
Figure 3
Figure 3A. Effects of elevating concentration of glucose on glucose to lactate conversion in N2a cells at 24 Hr. The data represent lactic acid produced (mM) and glucose remaining (mM) [non-utilized glucose] and are presented as the Mean ± S.E.M. n=4. Significance of difference between the cell control vs., treatment groups were determined by a one–way ANOVA followed by a Tukey post hoc test * p<0.05. Figure 3B. Effects of elevating concentration of glucose on glucose to lactate conversion in N2a cells treated with MPP+ [500 μM] at 24 Hr. The data represent lactic acid produced (mM) and glucose remaining (mM) [non-utilized glucose] and are presented as the Mean ± S.E.M. n=4. Significance of difference between the cell control vs. treatment groups were determined by a one–way ANOVA followed by a Tukey post hoc test * p<0.05.
Figure 4
Figure 4
Figure 4A. Variable mRNA and protein expression profiles for family with sequence similarity 162, member A (Fam162a) in N2a cells treated ± 500μM MPP+ at 24 Hr. The data represent mRNA gene (normalized g processed signal) % Ctrl (Left) and protein band intensity determined from Western Blot (Right). The data are presented as the Mean ± S.E.M., n=3. Significance of difference between the control and treatment groups were determined by a students t-test, * p<0.05. Figure 4B. Variable mRNA and protein expression profiles for pyruvate kinase in N2a cells treated ± 500μM MPP+ at 24 Hr. The data represent mRNA gene normalized g Processed Signal % Ctrl (Left), diverse hybridization probes for similar genes (legend below) and protein band intensity determined from Western Blot (Right). The data are presented as the Mean ± S.E.M., n=3. Significance of difference between the control and treatment groups were determined by a students t-test, * p<0.05. Figure 4C. Variable mRNA and protein expression profiles for LDH-A in N2a cells treated ± 500μM MPP+ at 24 Hr. The data represent mRNA (normalized g processed signal) % Ctrl (Left), diverse hybridization probes for similar genes (legend below) and protein band intensity determined from Western Blot (Right). The data are presented as the Mean ± S.E.M., n=3. Significance of difference between the control and treatment groups were determined by a students t-test, * p<0.05.
Figure 4
Figure 4
Figure 4A. Variable mRNA and protein expression profiles for family with sequence similarity 162, member A (Fam162a) in N2a cells treated ± 500μM MPP+ at 24 Hr. The data represent mRNA gene (normalized g processed signal) % Ctrl (Left) and protein band intensity determined from Western Blot (Right). The data are presented as the Mean ± S.E.M., n=3. Significance of difference between the control and treatment groups were determined by a students t-test, * p<0.05. Figure 4B. Variable mRNA and protein expression profiles for pyruvate kinase in N2a cells treated ± 500μM MPP+ at 24 Hr. The data represent mRNA gene normalized g Processed Signal % Ctrl (Left), diverse hybridization probes for similar genes (legend below) and protein band intensity determined from Western Blot (Right). The data are presented as the Mean ± S.E.M., n=3. Significance of difference between the control and treatment groups were determined by a students t-test, * p<0.05. Figure 4C. Variable mRNA and protein expression profiles for LDH-A in N2a cells treated ± 500μM MPP+ at 24 Hr. The data represent mRNA (normalized g processed signal) % Ctrl (Left), diverse hybridization probes for similar genes (legend below) and protein band intensity determined from Western Blot (Right). The data are presented as the Mean ± S.E.M., n=3. Significance of difference between the control and treatment groups were determined by a students t-test, * p<0.05.
Figure 5
Figure 5
Figure 5A. Relative protein expression for basic proteins of interest in N2a ± 500μM MPP+ at 12–24 Hours. Figure 5B. Variable mRNA and expression profiles for proteins of interest in N2a cells treated ± MPP+ [500μM ] at 24 Hr. The data represent mRNA (normalized g processed signal) % Ctrl (Left) presented as the Mean ± S.E.M., n=3. Significance of difference between the control and treatment groups were determined by a students t-test * p<0.05. Corresponding western blots displaying protein expression (Right).
Figure 6
Figure 6
Conversion rate of various metabolic substrates (10mM) to lactic acid in N2a cells in the absence of glucose at 24 Hrs. The data represent Lactic Acid Produced (μM/mg protein) and are presented as the Mean ± S.E.M., n=4. N.D. (not detected).
Figure 7
Figure 7
Summary of major MPP+ evoked changes in the transcriptome of N2a cells at 24 hours.
Figure 7
Figure 7
Summary of major MPP+ evoked changes in the transcriptome of N2a cells at 24 hours.

Similar articles

Cited by

References

    1. Absi E, Ayala A, Machado A, Parrado J. Protective effect of melatonin against the 1-methyl-4-phenylpyridinium-induced inhibition of complex I of the mitochondrial respiratory chain. J Pineal Res. 2000;29:40–7. - PubMed
    1. Akashi S, Kimura T, Takeuchi T, Kuramochi K, Kobayashi S, Sugawara F, et al. Neoechinulin a impedes the progression of rotenone-induced cytotoxicity in PC12 cells. Biol Pharm Bull. 2011;34:243–8. - PubMed
    1. Albers MJ, Bok R, Chen AP, Cunningham CH, Zierhut ML, Zhang VY, et al. Hyperpolarized 13C lactate, pyruvate, and alanine: noninvasive biomarkers for prostate cancer detection and grading. Cancer Res. 2008;68:8607–15. - PMC - PubMed
    1. Araki T, Milbrandt J. Ninjurin, a novel adhesion molecule, is induced by nerve injury and promotes axonal growth. Neuron. 1996;17:353–61. - PubMed
    1. Asgari S, Vespa P, Bergsneider M, Hu X. Lack of consistent intracranial pressure pulse morphological changes during episodes of microdialysis lactate/pyruvate ratio increase. Physiol Meas. 2011;32:1639–51. - PMC - PubMed

Publication types

MeSH terms