. 2012 Jul 9:10:142.
doi: 10.1186/1479-5876-10-142.

Metabolomic profiling in blood from umbilical cords of low birth weight newborns

Affiliations

Metabolomic profiling in blood from umbilical cords of low birth weight newborns

Carmen Ivorra et al. J Transl Med. .

Abstract

Background: Low birth weight has been linked to an increased risk to develop obesity, type 2 diabetes, and hypertension in adult life, although the mechanisms underlying the association are not well understood. The objective was to determine whether the metabolomic profile of plasma from umbilical cord differs between low and normal birth weight newborns.

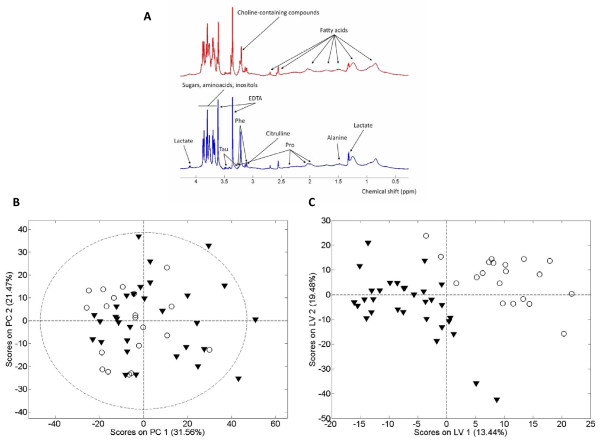
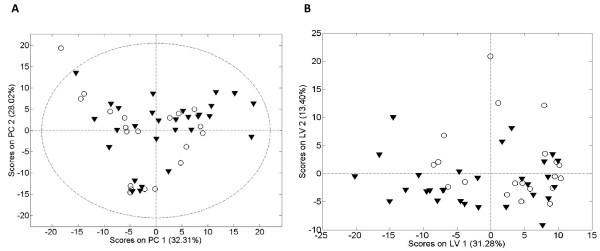
Methods: Fifty healthy pregnant women and their infants were selected. The eligibility criteria were being born at term and having a normal pregnancy. Pairs were grouped according to their birth weight: low birth weight (LBW, birth weight < 10th percentile, n = 20) and control (control, birth weight between the 75th-90th percentiles, n = 30). Nuclear Magnetic Resonance (NMR) was used to generate metabolic fingerprints of umbilical cord plasma samples. Simultaneously, the metabolomic profiles of the mothers were analysed. The resulting data were subjected to chemometric, principal component and partial least squares discriminant analyses.

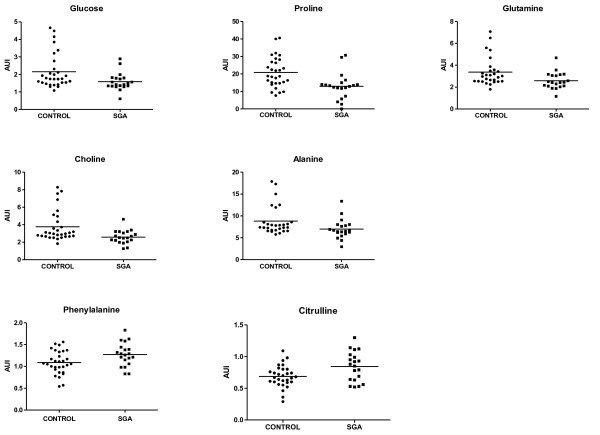
Results: Umbilical cord plasma from LBW and control newborns displayed a clearly differentiated metabolic profile. Seven metabolites were identified that discriminate the LBW from the control group. LBW newborns had lower levels of choline, proline, glutamine, alanine and glucose than did the control newborns, while plasma levels of phenylalanine and citrulline were higher in LBW newborns (p < 0.05). No significant differences were found between the two groups of mothers.

Conclusions: Low birth weight newborns display a differential metabolomic profile than those of normal birth weight, a finding not present in the mothers. The meaning and the potential utility of the findings as biomarkers of risk need to be addressed in future studies.


Figures

Figure 1
Figure 1
Umbilical cord blood profile. Superposed 1 H NMR spectra for the spectra of umbilical cord blood plasma (Panel A), Principal Component Analysis scores plot (PCA, panel B), and Projection to Latent Structures for Discriminant Analysis scores plot (PLS-DA, panel C) showing the global metabolic differences between low birth weight (open circles, blue spectra) and control birth weight (black triangles and red spectra) newborns. Although an unsupervised analysis by PCA does not show differences between groups, a supervised classification method (PLS-DA) provides a differential global metabolic profile. The cross-validated error percentage of the model for the classification of low weight at birth samples is 8%. Metabolites exhibiting largest differences between groups have been listed in Table 2.
Figure 2
Figure 2
Metabolites distinguishing LBW and control newborns. Glucose, Proline, Glutamine, Choline, and Alanine levels were higher in control newborns. Significantly higher levels of citrulline and phenylalanine were detected in umbilical cord plasma from LBW newborns. Mean metabolite abundance is indicated by line. Each point represents a single newborn.
Figure 3
Figure 3
Spectra of maternal venous plasma. Principal Component Analysis (PCA, panel A) and Projection to Latent Structures for Discriminant Analysis (PLS-DA, panel B) scores plot for the spectra of maternal venous plasma showing the global metabolic differences between low birth weight (open circles) and control birth weight (black triangles ) newborns. Apparently, there are no global metabolic trends in the maternal blood associated with the weight of the newborns.

Similar articles

Cited by

References

    1. Barker DJ, Gluckman PD, Godfrey KM, Harding JE, Owens JA, Robinson JS. Fetal nutrition and cardiovascular disease in adult life. Lancet. 1993;341:938–941. doi: 10.1016/0140-6736(93)91224-A. - DOI - PubMed
    1. Burdge GC, Lillycrop KA. Nutrition, epigenetics, and developmental plasticity: implications for understanding human disease. Annu Rev Nutr. 2010;30:315–339. doi: 10.1146/annurev.nutr.012809.104751. - DOI - PubMed
    1. Lubchenco L, Hansman C, Dressler M, Boyd E. Intrauterine growth as estimated from liveborn birth-weight data at 24 to 42 weeks of gestation. Pediatrics. 1963;32:793–800. - PubMed
    1. Godfrey KM, Barker DJ. Fetal nutrition and adult disease. Am J Clin Nutr. 2000;71(Suppl 5):1344S–1352S. - PubMed
    1. Hales CN, Ozanne SE. The dangerous road of catch-up growth. J Physiol. 2003;547(Pt 1):5–10. - PMC - PubMed

Publication types