. 2012 Oct 15;63(1):232-9.
doi: 10.1016/j.neuroimage.2012.06.055. Epub 2012 Jul 6.

Endotoxin-induced systemic inflammation activates microglia: [¹¹C]PBR28 positron emission tomography in nonhuman primates

Affiliations

Endotoxin-induced systemic inflammation activates microglia: [¹¹C]PBR28 positron emission tomography in nonhuman primates

Jonas Hannestad et al. Neuroimage. .

Abstract

Microglia play an essential role in many brain diseases. Microglia are activated by local tissue damage or inflammation, but systemic inflammation can also activate microglia. An important clinical question is whether the effects of systemic inflammation on microglia mediate the deleterious effects of systemic inflammation in diseases such as Alzheimer's dementia, multiple sclerosis, and stroke. Positron Emission Tomography (PET) imaging with ligands that bind to Translocator Protein (TSPO) can be used to detect activated microglia. The aim of this study was to evaluate whether the effect of systemic inflammation on microglia could be measured with PET imaging in nonhuman primates, using the TSPO ligand [(11)C]PBR28.

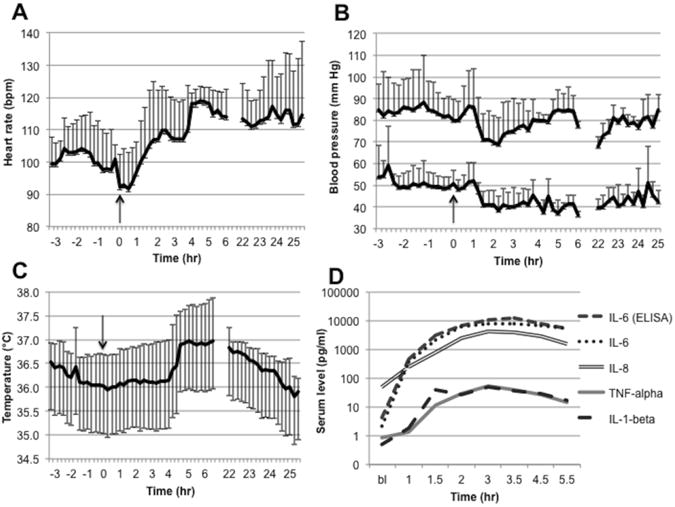
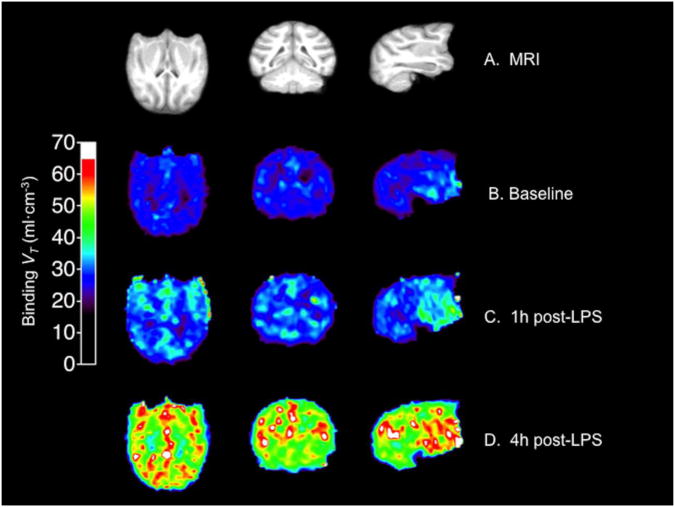
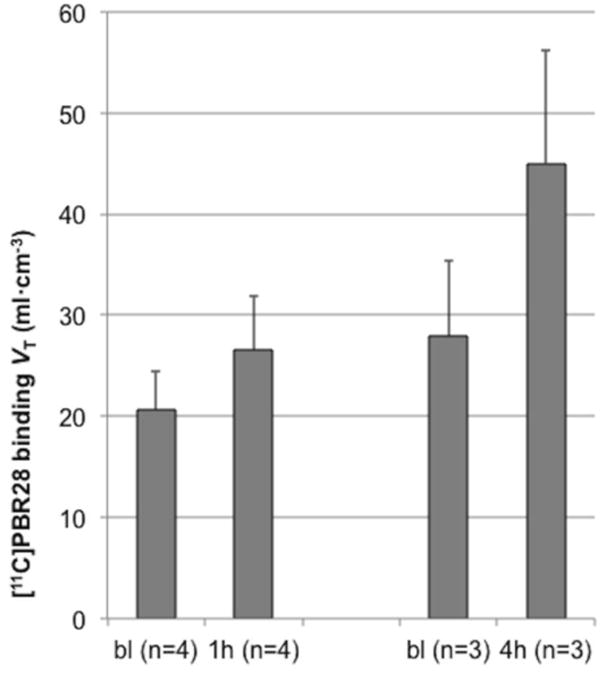
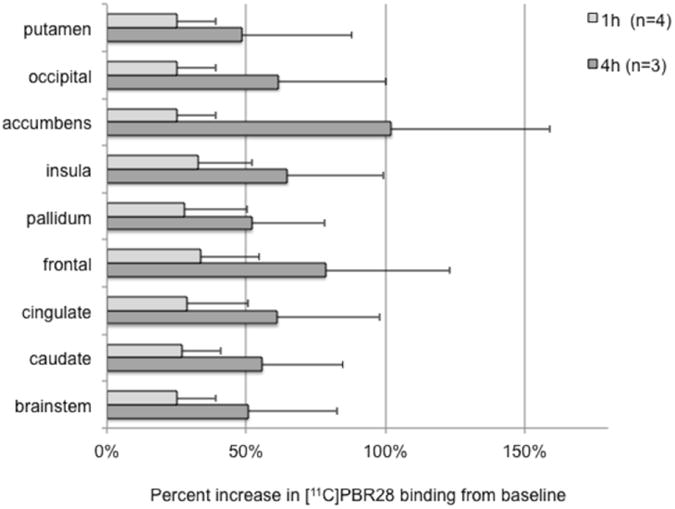
Methods: Six female baboons (Papio anubis) were scanned before and at 1h and/or 4h and/or 22 h after intravenous administration of E. coli lipopolysaccharide (LPS; 0.1mg/kg), which induces systemic inflammation. Regional time-activity data from regions of interest (ROIs) were fitted to the two-tissue compartmental model, using the metabolite-corrected arterial plasma curve as input function. Total volume of distribution (V(T)) of [(11)C]PBR28 was used as a measure of total ligand binding. The primary outcome was change in V(T) from baseline. Serum levels of tumor necrosis factor alpha (TNFα), interleukin-1 beta (IL-1β), interleukin-6 (IL-6), and interleukin-8 (IL-8) were used to assess correlations between systemic inflammation and microglial activation. In one baboon, immunohistochemistry was used to identify cells expressing TSPO.

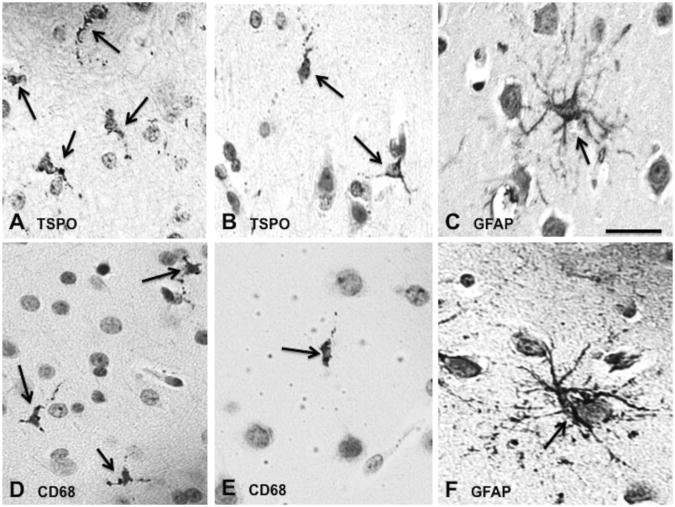
Results: LPS administration increased [(11)C]PBR28 binding (F(3,6)=5.1, p=.043) with a 29 ± 16% increase at 1h (n=4) and a 62 ± 34% increase at 4h (n=3) post-LPS. There was a positive correlation between serum IL-1β and IL-6 levels and the increase in [(11)C]PBR28 binding. TSPO immunoreactivity occurred almost exclusively in microglia and rarely in astrocytes.

Conclusion: In the nonhuman-primate brain, LPS-induced systemic inflammation produces a robust increase in the level of TSPO that is readily detected with [(11)C]PBR28 PET. The effect of LPS on [(11)C]PBR28 binding is likely mediated by inflammatory cytokines. Activation of microglia may be a mechanism through which systemic inflammatory processes influence the course of diseases such as Alzheimer's, multiple sclerosis, and possibly depression.


Figures

Fig. 1
Fig. 1
The physiologic and immune response to LPS administration. LPS was administered at 0h (arrows), and each data point pre- and post-LPS administration represents data (mean and standard deviation) from all baboons measured at a given time: n = 6 for the pre-LPS through 3h period, n = 3 for the 4h through 6h period, and n = 2 for the 22h through 25h period. (A) Heart rate increased after LPS administration and stayed elevated until the following day. (B) Systolic and diastolic blood pressure increased slightly after LPS administration and subsequently decreased. Systolic blood pressure normalized after approximately 4 hours, while diastolic blood pressure remained lower until the following day. (C) Rectal temperature increased approximately 4 hours after LPS administration and remained elevated until the following day. (D) Levels of inflammatory cytokines (TNFα, IL-1β, IL-6, and IL-8) increased after LPS administration. IL-6 levels were measured with both electrochemiluminenscence and immunsorbent assays (see Methods for details). Abbreviations: ELISA, enzyme-linked immunosorbent assay; IL, interleukin; LPS, lipopolysaccharide; TNF, tumor necrosis factor.
Fig. 2
Fig. 2
Change in [11C]PBR28 binding (VT) after LPS administration in the one baboon that had a PET scan at baseline and 1h and 4h post-LPS (the other baboons had either a 1h or a 4h scan). (A) MRI from this baboon. (B) [11C]PBR28 binding at baseline. (C) [11C]PBR28 binding 1h post-LPS. (D) [11C]PBR28 binding 4h post-LPS. Abbreviations: LPS, lipopolysaccharide; MRI, magnetic resonance imaging; VT, total volume of distribution.
Fig. 3
Fig. 3
Mean change in [11C]PBR28 binding (VT) after LPS administration. In this figure the mean of each set of scans (1h and 4h post-LPS) is compared to their respective baseline means. One hour post-LPS (n = 4), [11C]PBR28 binding increased 28.8±15.7% (range 11.5%-47.4%). Four hours post-LPS (n = 3), [11C]PBR28 binding increased 61.8±34.4% (range 35.6%-100.7%). Error bars denote standard deviation. Abbreviations: bl, baseline; VT, total volume of distribution.
Fig. 4
Fig. 4
Percent increase in binding from baseline in each region of interest (ROI). The light gray bars show mean (n = 4) percent increase from 0h to 1h in each ROI, while the dark gray bars show mean (n = 3) percent increase from 0h to 4h. Error bars denote standard deviation.
Fig. 5
Fig. 5
Immunohistochemistry from the frontal lobe of one baboon that was killed 6h after LPS administration (immediately after the end of the 4h-post-LPS scan). Cells immunoreactive for TSPO (A, B) were small, rod-like cells with fine branches that were similar to cells immunoreactive for the microglial marker CD68 (D, E). Conversely, immunoreactivity for the astrocytic marker GFAP (C, F) was found cells that were much larger, more numerous, and that had more prominent processes. Scale bar = 100 μm.

References

    1. Batarseh A, Papadopoulos V. Regulation of translocator protein 18 kDa (TSPO) expression in health and disease states. Mol Cell Endocrinol. 2010;327:1–12. - PMC - PubMed
    1. Block ML, Zecca L, Hong JS. Microglia-mediated neurotoxicity: uncovering the molecular mechanisms. Nat Rev Neurosci. 2007;8:57–69. - PubMed
    1. Bower JE. Cancer-related fatigue: links with inflammation in cancer patients and survivors. Brain Behav Immun. 2007;21:863–871. - PMC - PubMed
    1. Chakravarty S, Herkenham M. Toll-like receptor 4 on nonhematopoietic cells sustains CNS inflammation during endotoxemia, independent of systemic cytokines. J Neurosci. 2005;25:1788–1796. - PMC - PubMed
    1. Chan WY, Kohsaka S, Rezaie P. The origin and cell lineage of microglia: new concepts. Brain Res Rev. 2007;53:344–354. - PubMed

Publication types

LinkOut - more resources