. 2012 Aug 23;120(8):1601-12.
doi: 10.1182/blood-2011-11-393983. Epub 2012 Jul 9.

Necdin, a p53 target gene, regulates the quiescence and response to genotoxic stress of hematopoietic stem/progenitor cells

Affiliations

Necdin, a p53 target gene, regulates the quiescence and response to genotoxic stress of hematopoietic stem/progenitor cells

Takashi Asai et al. Blood. .

Abstract

We recently defined a critical role for p53 in regulating the quiescence of adult hematopoietic stem cells (HSCs) and identified necdin as a candidate p53 target gene. Necdin is a growth-suppressing protein and the gene encoding it is one of several that are deleted in patients with Prader-Willi syndrome. To define the intrinsic role of necdin in adult hematopoiesis, in the present study, we transplanted necdin-null fetal liver cells into lethally irradiated recipients. We show that necdin-null adult HSCs are less quiescent and more proliferative than normal HSCs, demonstrating the similar role of necdin and p53 in promoting HSC quiescence during steady-state conditions. However, wild-type recipients repopulated with necdin-null hematopoietic stem/progenitor cells show enhanced sensitivity to irradiation and chemotherapy, with increased p53-dependent apoptosis, myelosuppression, and mortality. Necdin controls the HSC response to genotoxic stress via both cell-cycle-dependent and cell-cycle-independent mechanisms, with the latter occurring in a Gas2L3-dependent manner. We conclude that necdin functions as a molecular switch in adult hematopoiesis, acting in a p53-like manner to promote HSC quiescence in the steady state, but suppressing p53-dependent apoptosis in response to genotoxic stress.


Figures
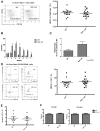
Figure 1
Figure 1
Necdin is dispensable for fetal hematopoiesis. (A) The frequency of immunophenotypic HSCs in necdin-null (Ndn-null) fetal livers (LinSca-1+Mac1+CD48CD150+ cells) quantified by flow cytometry was normal. The mean percentage (± SD) of LinSca-1+Mac1+CD48CD150+ cells in the fetal liver are shown (P = .64, n = 15). (B) Serial replating studies were performed using fetal liver cells. CFUs were quantified by methylcellulose culture using wild-type (WT) and necdin-null fetal liver cells. The methylcellulose cultures were serially replated weekly for 7 weeks. Mean values (± SD) are shown (n = 4). (C) Wild-type and necdin-null LinSca1+Mac1+CD150+ cells (5 × 10²) were cultured on MS5 stromal cells for 4 weeks and tested for colony formation in the long-term culture-initiating cell assay. Data shown are the mean relative number of colonies formed relative to wild-type colonies (± SD) from 2 independent studies (P = .025, n = 5). (D) Cell-cycle analysis of LinSca-1+Mac1+CD48CD150+ cells was performed by staining with Hoechst 33342 and Ki67 and analyzed by flow cytometry using an FITC mouse IgG1 Ab as the isotype control. Ki67 cells are defined as HSCs in G0 (left panels). Data shown are the mean values (± SD; P = .5, n = 15, right panel). (E) Apoptosis of wild-type and necdin-null fetal liver HSCs was assessed using DAPI and annexin V staining. Data shown are the mean percentage (± SD) of annexin V+/DAPI LinSca-1+Mac1+CD48CD150+ cells (P = .71, n = 7). (F) Wild-type or necdin-null fetal liver cells (5 × 10⁵) were transplanted into lethally irradiated recipients, and spleen colonies were scored on days 8 and 12 after transplantation. Numbers indicate average colony numbers (± SD). CFU-spleen day 8 (CFU-S8), P = .53, n = 5; CFU-spleen day 12 (CFU-S12), P = .86, n = 5.
Figure 2
Figure 2
The role of necdin in adult hematopoiesis. (A) Necdin-null (Ndn-null) fetal liver cells (CD45.2) normally repopulated lethally irradiated recipient mice (CD45.1). The frequency of donor-derived cells (CD45.2) in peripheral blood was measured monthly by flow cytometry at 4 time points. SDs are shown (left panel). Right panels show the data from flow cytometry 16 weeks after transplantation. (B) Recipient mice receiving necdin-null fetal liver cells (1 × 10⁶) showed normal multilineage reconstituting activity, as assessed by the percentage of donor-derived myeloid cells (bottom left panel), B cells (top right panel), and T cells (top left panel) 16 weeks after transplantation using flow cytometry. (C) The frequency of HSCs (LinSca-1+c-kit+CD48CD150+ cells) in the BM of mice reconstituted with wild-type (WT) or necdin-null fetal liver cells was measured by flow cytometric analysis using SLAM cell-surface markers. Data shown are the mean percentage of HSCs (± SD; P = .1, n = 14). (D) Analysis of the common myeloid progenitor (CMP), granulocyte monocyte progenitor (GMP), and megakaryocyte erythrocyte progenitor (MEP) compartments showed comparable frequencies for those transplanted mice that received wild-type versus necdin-null fetal liver cells (P = .44, P = .41, P = .33, respectively, n = 6).
Figure 3
Figure 3
Loss of necdin has no effects on adult HSC self-renewal in vivo. (A) Serial replating studies. CFUs were quantified by methylcellulose culture using BM mononuclear cells from mice reconstituted with wild-type (WT) or necdin-null (Ndn null) fetal liver cells. The methylcellulose cultures were serially replated weekly for 4 weeks. Mean values (± SD) are shown (n = 4). (B) Donor repopulation after serial BM transplantation. Initially, we transplanted 1 × 10⁶ fetal liver cells from wild-type or necdin-null mice (CD45.2) into lethally irradiated B6.SJL mice (CD45.1). Sixteen weeks after transplantation, we harvested 2 × 10⁶ BM cells from mice reconstituted with wild-type and necdin-null fetal liver cells and transplanted the cells into lethally irradiated B6.SJL mice (CD45.1). The frequency of donor-derived cells (CD45.2) in the peripheral blood was measured 16 weeks after primary, secondary, and tertiary transplantation by flow cytometry. No differences were found between the groups (n = 10). (C) Lethally irradiated recipient mice (CD45.1) were transplanted with 1 × 10⁶ wild-type or necdin-null fetal liver cells (CD45.2) plus 1 × 10⁶ competitor fetal liver cells (CD45.1). The graph shows the mean percentage (± SD) of donor-derived (CD45.2) cells in the peripheral blood 16 weeks after transplantation (n = 7, P = .50). (D) BM cells from mice reconstituted with wild-type or necdin-null fetal liver cells were stained for HSC surface markers and assessed for apoptosis using DAPI and annexin V staining. Data shown are mean percentage of annexin V+/DAPI HSCs (LinSca1+Mac1+CD48CD150+ cells) ± SD (P = .86, n = 4, left panel). The right panels show representative flow cytometry data: annexin V staining versus DAPI staining. (E-F) Fetal liver cell homing and lodging ability in irradiated and nonirradiated recipient mice was analyzed. Wild-type or necdin-null fetal liver cells (5 × 10⁶; CD45.2) were injected into lethally irradiated (E) or nonirradiated (F) recipient mice (CD45.1). BM cells were harvested 18 hours after injection and CD45.2+ donor-derived cells were enumerated on the LinSca1+Mac1+ population by flow cytometry. Data shown are mean percentages (± SD) of cells that homed (E) or lodged (F) within the LinSca1+Mac1+ cells (E: P = .92, F: P = .48, n = 5).
Figure 4
Figure 4
Necdin maintains adult HSC quiescence. (A) Cell-cycle analysis of LinSca-1+c-Kit+CD48CD150+ cells (left panels) isolated from mice reconstituted with wild-type (WT) or necdin-null (Ndn null) fetal liver cells was performed by staining with Hoechst 33 342 and Ki67. Data shown are the mean values of G0 cells (± SD; P = .0025, n = 7). (B) The proliferation of LinSca-1+c-Kit+CD48CD150+ cells isolated from mice reconstituted with wild-type or necdin-null fetal liver cells was measured by in vivo BrdU incorporation over 48 hours. Greater proliferation of necdin-null LinSca-1+c-Kit+CD48CD150+ cells was observed (38.9% vs 14.8% for wild-type cells; P = .0007, n = 7). (C) Cell-cycle analysis of LinSca-1+c-Kit+CD48CD150+ cells isolated from the BM of mice reconstituted with wild-type, necdin-null, p53-null, or necdin/p53 double-null fetal liver cells was performed by staining with Hoechst 33342 and Ki67. Data shown are the mean values of G0 cells (± SD; P < .0001 by 1-way ANOVA, n = 4). Significant differences were observed between wild-type and necdin-null, wild-type and p53-null, wild-type and necdin/p53 double-null, necdin-null and p53-null, and p53-null and necdin/p53 double-null recipients.
Figure 5
Figure 5
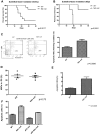
Necdin-null hematopoietic cells are highly sensitive to chemotherapy. (A) Survival after weekly 5-FU administration. 5-FU was administered intraperitoneally weekly (the initial dose was 125 mg/kg, with subsequent doses of 90 mg/kg) and the survival rates of mice repopulated with wild-type (WT) or necdin-null (Ndn null) fetal liver cells were measured. Results were analyzed with a log-rank nonparametric test and expressed as Kaplan-Meier survival curves (P = .0387, n = 10). (B) Hematopoietic reconstitution was monitored by serial peripheral blood count of mice injected with a single dose of 5-FU (200 mg/kg intraperitoneally). WBC counts are shown at each point after 5-FU administration as a percentage of the initial values for each group of mice (mean ± SD; n = 3 for each time point). (C) Gross morphology of femurs from untreated mice and mice 14 days after 5-FU administration is shown. Slides were stained with H&E. The slides were analyzed under a Zeiss Axioplan 2 Upright Wide-field Microscope (Carl Zeiss) equipped with a Zeiss AxiCam HRc Camera (Carl Zeiss; original magnification ×100 with a 10× objective). The images were acquired by a Volocity software (PerkinElmer). (D) HSCs isolated from the mice repopulated with wild-type or necdin-null fetal liver cells were assessed for apoptosis 60 hours after a dose of 5-FU (200 mg/kg intraperitoneally) using DAPI and annexin V staining. Data shown are mean percentage (± SD) of annexin V+/DAPI LinSca-1+c-Kit+CD48CD150+ cells (P = .015, n = 5). (E) The proliferation of LinSca-1+c-Kit+CD48CD150+ cells isolated from mice reconstituted with wild-type or necdin-null fetal liver cells 4 days after 5-FU administration was measured by BrdU incorporation in vivo over 48 hours (P = .76, n = 5).
Figure 6
Figure 6
Necdin-null hematopoietic cells are highly sensitive to irradiation. (A) Survival curves for mice reconstituted with wild-type (WT) or necdin-null (Ndn null) fetal liver cells, given total body irradiation (6.5 Gy), and monitored regularly for survival (P = .0017, n = 10). (B) Survival curves for mice reconstituted with wild-type or necdin-null fetal liver cells given TBI (8 Gy) and monitored regularly for survival (P = .0091, n = 8). (C) HSCs (LinSca-1+c-Kit+CD48CD150+ cells) from the BM of the mice repopulated with wild-type or necdin-null fetal liver cells were assessed for apoptosis 12 hours after a dose of total-body irradiation (6.5 Gy) using DAPI and annexin V staining (left panels). Data shown are the mean percentage (± SD) of the annexin V+/DAPI population in LinSca-1+c-Kit+CD48CD150+ cells (P = .0098, n = 5, right panel). (D) Cell-cycle analysis of HSCs after G-CSF treatment (200 μg/kg daily). LinSca-1+c-Kit+CD48CD150+ cells isolated from mice reconstituted with wild-type or necdin-null fetal liver cells after 5 days of G-CSF treatment were analyzed by staining with Hoechst 33342 and Ki67. Data shown are the mean values of G0 cells (± SD; P = .75, n = 5). (E) Apoptosis of HSCs after G-CSF treatment (200 μg/kg daily). HSCs from the BM of the 5-day G-CSF–treated mice repopulated with wild-type or necdin-null fetal liver cells were assessed for apoptosis 12 hours after a dose of total body irradiation (6.5 Gy) using DAPI and annexin V. Data shown are the mean percentage (± SD) of the annexin V+/DAPI population in LinSca-1+c-Kit+CD48CD150+ cells (P < .005, n = 4). (F) HSCs (LinSca-1+c-Kit+CD48CD150+) from the BM of mice repopulated with wild-type, necdin-null, p53-null, or necdin/p53 double-null fetal liver cells were assessed for apoptosis 12 hours after a dose of total body irradiation (6.5 Gy) using DAPI and annexin V staining. Data shown are the mean percentage ± SD of the annexin V+/DAPI population within HSCs (P < .0001 by 1-way ANOVA, n = 4). Significant differences were observed between wild-type and necdin-null, wild-type and p53-null, necdin-null and p53-null, necdin-null and necdin/p53 double-null, and p53-null and necdin/p53 double-null recipients.
Figure 7
Figure 7
Molecular mechanisms of necdin in regulating the response of HSCs to irradiation. (A) Transcript profiling of LSK cells from mice reconstituted with wild-type (WT) and necdin-null (Ndn null) fetal liver cells after a sublethal dose of irradiation (6.5 Gy) were analyzed by Affymetrix oligonucleotide array. Genes that are differentially expressed between wild-type and necdin-null HSPCs are shown. (B) The relative mRNA expression level of Gas2L3 in LSK cells isolated from mice reconstituted with wild-type or necdin-null fetal liver cells after a sublethal dose of irradiation (6.5 Gy) was evaluated by quantitative PCR and normalized to hypoxanthine-guanine phosphoribosyltransferase expression. Data shown are the mean ratio (± SD) of transcript levels relative to that of wild-type cells (n = 2). (C) Effect of down-regulating Gas2L3 expression on the HSPC response to irradiation. Wild-type or necdin-null LSK cells were nucleofected with control or Gas2L3-directed siRNAs. Twenty-four hours after nucleofection, the cells, which showed efficient Gas2L3 knockdown in LSK cells by quantitative PCR (left panel), were irradiated at 2 Gy and their apoptosis was measured by annexin V and DAPI staining. Data shown are mean values (± SD; P < .0001 by 1-way ANOVA, n = 6, right panel). Significant differences were observed between control/wild-type and Gas2L3 knockdown/wild-type, control/wild-type and control/necdin-null, control/wild-type and Gas2L3 knockdown/necdin-null, Gas2L3 knockdown/wild-type and control/necdin-null, and control/necdin-null and Gas2L3 knockdown/necdin-null. (D) Effect of Gas2L3 overexpression on the HSPC response to irradiation. Gas2L3 overexpression in LSK cells was confirmed by quantitative PCR (n = 2, left panel); the cells were then irradiated at 2 Gy and their apoptosis was measured by annexin V and DAPI staining. Data shown are mean values (± SD; P = .01, n = 5, right panel). (E) Green fluorescent protein–positive HSCs (LinSca-1+c-Kit+CD48CD150+) from the BM of the mice repopulated with wild-type control, wild-type Gas2L3 knocked-down 1 (KD1), wild-type Gas2L3 KD2, necdin-null control, necdin-null Gas2L3 KD1, or necdin-null Gas2L3 KD2 fetal liver cells were assessed for apoptosis 12 hours after a dose of total-body irradiation (6.5 Gy) using DAPI and annexin V staining. Data shown are the mean percentage ± SD of the annexin V+/DAPI population within HSCs (P < .0001 by 1-way ANOVA). Significant differences were observed between wild-type control and wild-type Gas2L3 KD1, wild-type control and wild-type Gas2L3 KD2, wild-type control and necdin-null control, wild-type control and necdin-null Gas2L3 KD1, wild-type control and necdin-null Gas2L3 KD2, wild-type Gas2L3 KD1 and necdin-null control, wild-type Gas2L3 KD2 and necdin-null control, necdin-null control and necdin-null Gas2L3 KD1, and necdin-null control and necdin-null Gas2L3 KD2. (F) The relative mRNA expression levels of Gas2L3 in CD48CD150+LSK cells, CD34LSK cells, and CD34+LSK cells isolated from mice before and after a sublethal dose of irradiation (6.5 Gy) was evaluated by quantitative PCR and normalized to hypoxanthine-guanine phosphoribosyltransferase expression. Data shown are the mean ratio of transcript levels relative to the wild-type cells (± SD; n = 3).

References

    1. Orford KW, Scadden DT. Deconstructing stem cell self-renewal: genetic insights into cell-cycle regulation. Nat Rev Genet. 2008;9(2):115–128. - PubMed
    1. Kiel MJ, He S, Ashkenazi R, et al. Haematopoietic stem cells do not asymmetrically segregate chromosomes or retain BrdU. Nature. 2007;449(7159):238–242. - PMC - PubMed
    1. Foudi A, Hochedlinger K, Van Buren D, et al. Analysis of histone 2B-GFP retention reveals slowly cycling hematopoietic stem cells. Nat Biotechnol. 2009;27(1):84–90. - PMC - PubMed
    1. Wilson A, Laurenti E, Oser G, et al. Hematopoietic stem cells reversibly switch from dormancy to self-renewal during homeostasis and repair. Cell. 2008;135(6):1118–1129. - PubMed
    1. Wilson A, Trumpp A. Bone-marrow haematopoietic-stem-cell niches. Nat Rev Immunol. 2006;6(2):93–106. - PubMed

Publication types

MeSH terms