. 2013 Apr;15(2):194-202.
doi: 10.1007/s11307-012-0576-9.

Molecular imaging of neuroblastoma progression in TH-MYCN transgenic mice

Affiliations

Molecular imaging of neuroblastoma progression in TH-MYCN transgenic mice

Carmelo Quarta et al. Mol Imaging Biol. 2013 Apr.

Abstract

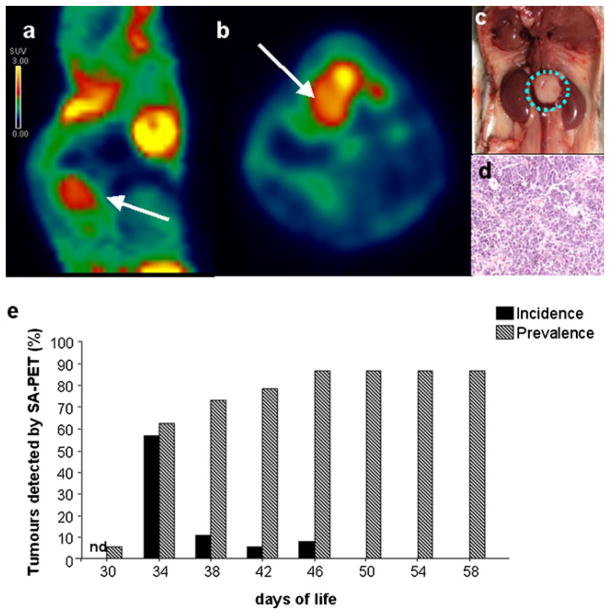
Purpose: TH-MYCN transgenic mice represent a valuable preclinical model of neuroblastoma. Current methods to study tumor progression in these mice are inaccurate or invasive, limiting the potential of this murine model. The aim of our study was to assess the potential of small animal positron emission tomography (SA-PET) to study neuroblastoma progression in TH-MYCN mice.

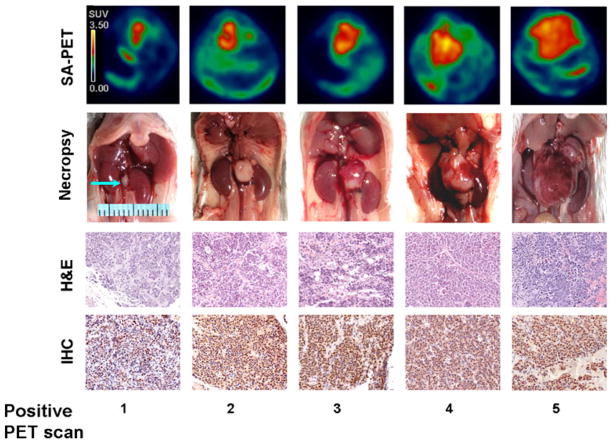
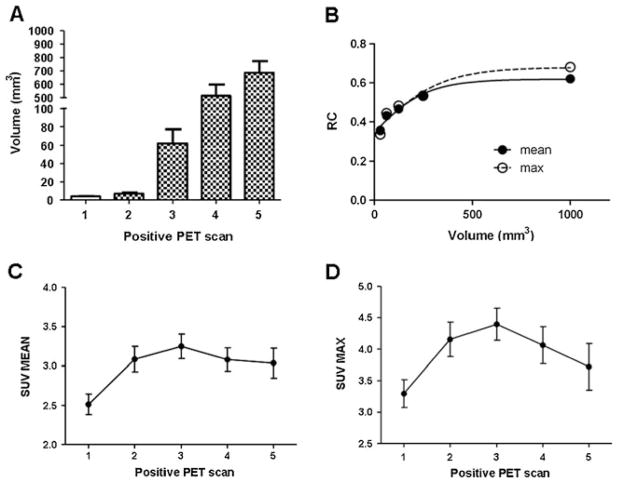
Procedure: Serial SA-PET scans using the tracer 2-deoxy-2-[(18)F]fluoro-D-glucose ((18)F-FDG) have been performed in TH-MYCN mice. Image analysis of tumor progression has been compared with ex vivo evaluation of tumor volumes and histological features.

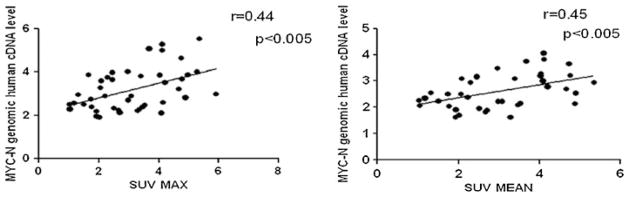
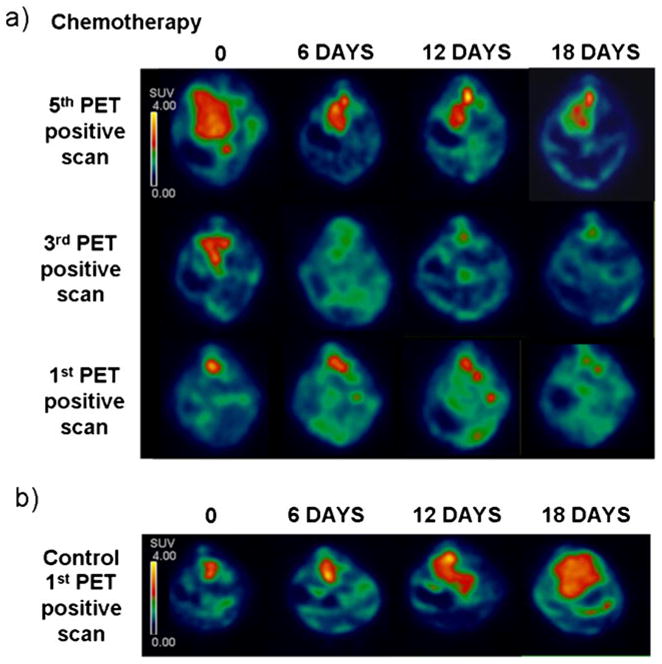
Results: [(18)F]FDG-SA-PET allowed to detect early staged tumors in almost 100 % of TH-MYCN mice positive for disease. Image analysis of tumor evolution reflected the modifications of the tumor volume, histological features, and malignancy during disease progression. Image analysis of TH-MYCN mice undergoing chemotherapy treatment against neuroblastoma provided information on drug-induced alterations in tumor metabolic activity.

Conclusions: These data show for the first time that [(18)F]FDG-SA-PET is a useful tool to study neuroblastoma presence and progression in TH-MYCN transgenic mice.


Conflict of interest statement

Conflict of Interest. The authors have no conflict of interest to declare.

Figures

Fig. 1
Fig. 1
Neuroblastoma detection in TH-MYCN mice by SA-PET imaging. a, b SA-PET image (sagittal and axial view, respectively) showing a paraspinal neuroblastoma lesion in a TH-MYCN transgenic mouse. c, d Appearance of the tumor shown in a and b at autopsy and by H&E histology. In all the mice studied, a paraspinal neuroblastoma mass localized between the kidneys and H&E staining showed a sheet-like arrangement. e Percent incidence (newly detected tumors) and prevalence of neuroblastoma detected by SA-PET scan in TH-MYCN homozygous mice analyzed every 4 days (n = 39). Nd not determined.
Fig. 2
Fig. 2
SA-PET and ex vivo analysis of tumor progression in TH-MYCN mice. Comparison between SA-PET and ex vivo analysis of tumor progression in TH-MYCN mice. SA-PET imaging (axial view), autopsy, H&E staining, and immunohistochemistry with monoclonal anti-N-Myc antibody (IHC) are shown in mice analyzed at five different stages of PET positivity. Radioactive counts in SA-PET images are expressed as SUV.
Fig. 3
Fig. 3
SA-PET analysis of tumor metabolism in TH-MYCN mice. a Tumor volumes calculated in TH-MYCN mice sacrificed at various time points of PET positivity. Data are expressed as mean±SEM. N = 4–5 for each time point. b Recovery coefficient (RC) values derived from SA-PET acquisition of radioactive spheres of several diameters. Data were fitted using a sigmoid function. c Analysis of SUVmean in five different PET time points reflecting different stages of positivity. Values are expressed as mean±SEM. N = 20–30 for each time point. d Analysis of SUVmax in five different PET time points reflecting different stages of positivity. Values are expressed as mean±SEM. N = 20–30 for each time point.
Fig. 4
Fig. 4
Correlation between SUV and MYCN transgene amount. Correlation between the human MYCN cDNA level and the SUVmean, or the SUVmax, in TH-MYCN homozygous mice analyzed at different stages of PET positivity. Spearman r values and linear regression slope are shown on the graphs.
Fig. 5
Fig. 5
SA-PET analysis of tumor regression after chemotherapy treatment in TH-MYCN mice. a SA-PET images (axial view) of three TH-MYCN mice treated with a chemotherapy cocktail against neuroblastoma. Chemotherapy treatment started after the fifth PET positive scan in mouse 1 (top), after the third PET positive scan in mouse 2 (middle), and after the first PET positive scan in mouse 3 (bottom). SA-PET scanning has been repeated in these mice after 6, 12, and 18 days from the starting of chemotherapy. Radioactive counts are expressed as SUV. b Control TH-MYCN mouse analyzed by SA-PET images after 6, 12, and 18 days from the first PET positive scan. Radioactive counts are expressed as SUV.

References

    1. Brodeur GM. Neuroblastoma: biological insights into a clinical enigma. Nat Rev Cancer. 2003;3:203–216. - PubMed
    1. Howman-Giles R, Shaw PJ, Uren RF, et al. Neuroblastoma and other neuroendocrine tumors. Semin Nucl Med. 2007;37:286–302. - PubMed
    1. Kushner BH. Neuroblastoma: a disease requiring a multitude of imaging studies. J Nucl Med. 2004;45:1172–1188. - PubMed
    1. Melzer HI, Coppenrath E, Schmid I, et al. 333I-MIBG scintigraphy/SPECT versus 18F-FDG PET in paediatric neuroblastoma. Eur J Nucl Med Mol Imaging. 2011;38:1648–1658. - PubMed
    1. Sharp SE, Shulkin BL, Gelfand MJ, et al. 123I-MIBG scintigraphy and 18F-FDG PET in neuroblastoma. J Nucl Med. 2009;50:1237–1243. - PubMed

Publication types