. 2012 Sep;2(9):826-39.
doi: 10.1158/2159-8290.CD-12-0107. Epub 2012 Jul 9.

CD36 repression activates a multicellular stromal program shared by high mammographic density and tumor tissues

Affiliations

CD36 repression activates a multicellular stromal program shared by high mammographic density and tumor tissues

Rosa Anna DeFilippis et al. Cancer Discov. 2012 Sep.

Abstract

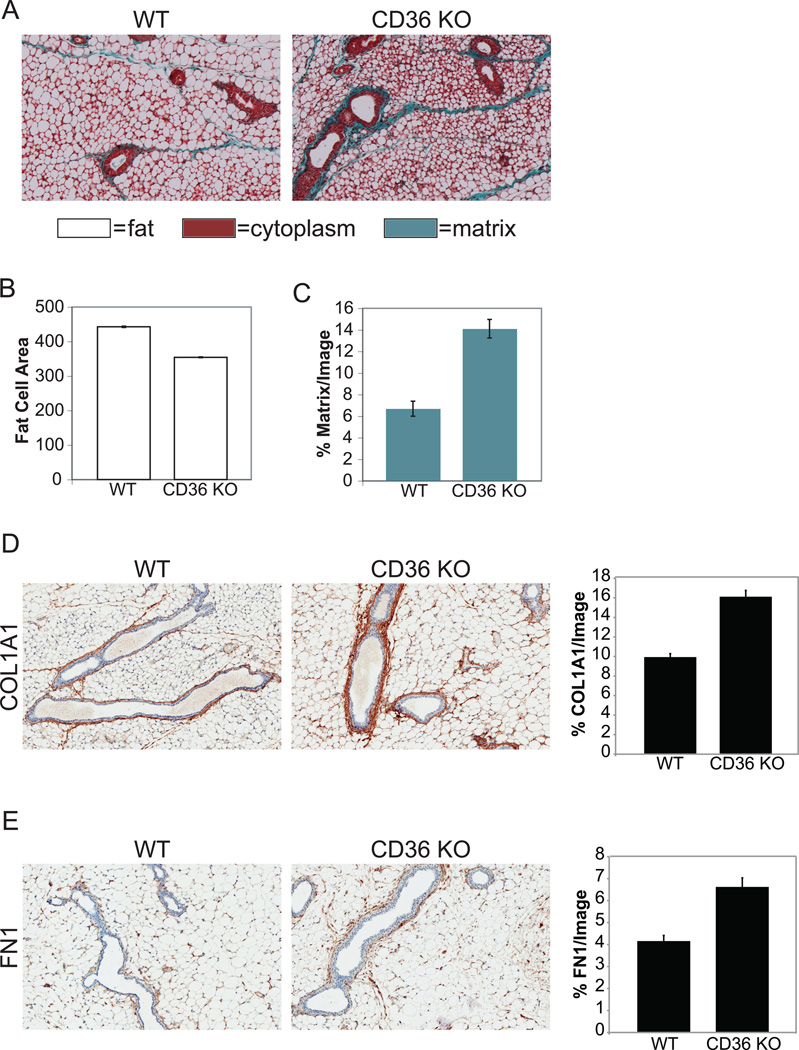
Although high mammographic density is considered one of the strongest risk factors for invasive breast cancer, the genes involved in modulating this clinical feature are unknown. Tissues of high mammographic density share key histologic features with stromal components within malignant lesions of tumor tissues, specifically low adipocyte and high extracellular matrix (ECM) content. We show that CD36, a transmembrane receptor that coordinately modulates multiple protumorigenic phenotypes, including adipocyte differentiation, angiogenesis, cell-ECM interactions, and immune signaling, is greatly repressed in multiple cell types of disease-free stroma associated with high mammographic density and tumor stroma. Using both in vitro and in vivo assays, we show that CD36 repression is necessary and sufficient to recapitulate the above-mentioned phenotypes observed in high mammographic density and tumor tissues. Consistent with a functional role for this coordinated program in tumorigenesis, we observe that clinical outcomes are strongly associated with CD36 expression.

Significance: CD36 simultaneously controls adipocyte content and matrix accumulation and is coordinately repressed in multiple cell types within tumor and high mammographic density stroma, suggesting that activation of this stromal program is an early event in tumorigenesis. Levels of CD36 and extent of mammographic density are both modifiable factors that provide potential for intervention.


Conflict of interest statement

No conflicts of interest

Figures

Figure 1
Figure 1. Desmoplasia and tissues with high MD share histologic characteristics
Representative bright field images (×5) of paraffin sections stained with hematoxylin and eosin (Nuclei: blue, ECM: pink, adipocytes: white). Left panels: desmoplastic tissue and histologically normal adjacent tissue from a patient with invasive ductal carcinoma. Right panels: cancer-free tissue from one woman with low MD and one woman with high MD.
Figure 2
Figure 2. Cultured fibroblasts recapitulate multiple phenotypes associated with their respective tissues of origin
(A) 3 LDAFs and 3 HDAFs were placed under proliferative (ctl) or adipocyte differentiation (+PJ2) conditions for 6 days and assessed for fat accumulation by Oil Red O staining. Representative bright field images (10×) of the fibroblasts under differentiation conditions. (B) Average and SEM of Oil Red O staining per cell. (C) 4 LDAFs and 4 HDAFs were placed under proliferative (ctl) or adipocyte differentiation conditions (+PJ2) for 2 weeks and assessed for adipocyte differentiation by measuring the expression of genes upregulated in adipogenesis. Average and SEM of CD36 and LEP expression by QPCR (n= 4 for each of 4 LDAFs and 4 HDAFs). (D) Representative fluorescent images (10×) highlighting differential ECM protein deposition in 6 LDAFs and 6 HDAFs grown for 5 days and assessed for accumulation of matrix proteins COL1A1, FN1, OPN and TNC. (E) Left panels: representative bright field images (10×) of 1 RMF and 2 CAFs under proliferative (ctl) or adipocyte differentiation (+PJ2) conditions for 7 days and assessed for adipocyte formation by Oil Red O staining. Right panel: average and SEM of Oil Red O staining per cell.
Figure 3
Figure 3. CD36 expression is decreased in HDAFs and CAFs relative to LDAFs and RMFs, respectively
(A) Average and SEM of CD36 expression measured by QPCR (n=3 for each of the 7 LDAFs and 7 HDAFs). (B) Western blot analyses for CD36 (top panel), where the arrows indicate CD36 glycosylated state, and actin (lower panel). Positive control for CD36 expression: RMF under proliferative (ctl) or adipocyte differentiation (+PJ2) conditions for 7 days. (C) Average and SEM of CD36 expression measured by QPCR (n=3 for each of the 8 RMFs and 8 CAFs).
Figure 4
Figure 4. CD36 expression is necessary and sufficient to modulate adipocyte differentiation and matrix accumulation in vitro
(A&B: left panels) Representative bright field images (10×) of shLuc, shCD36, vector or CD36 OE cells, under proliferative (ctl) or adipocyte differentiation (+PJ2) conditions for 7 days and assessed for adipocyte formation by Oil Red O staining. (A&B: right panels) Average and SEM of Oil Red O staining per cell. (C) Representative fluorescent images (10×) of shLuc, shCD36, vector and CD36 OE cells grown for 5 days and assessed for accumulation of matrix proteins COL1A1, FN1 and OPN. (D) Average and SEM of staining per cell expressed as signal ×104.
Figure 5
Figure 5. Cd36 knockout mice phenocopy human high MD and desmoplastic tissues
Representative bright field images (10×) of #4 mammary gland paraffin sections from either WT (n=7) or CD36 KO (n=5) mice stained with Masson’s Trichrome (A), or for COL1A1 (D, left panel) and FN1 (E, left panel). Average and SEM of fat cell area (B), or percent area of either matrix staining (C), COL1A1 staining (D, right panel) or FN1 staining (E, right panel).
Figure 6
Figure 6. CD36 expression is coordinately regulated in multiple cellular compartments
(A) Left panels: representative bright field images (20×) of paraffin sections from 13 LD and 14 HD tissues stained for CD36. Right panel: average and SEM of CD36 signal per cell. (B) Representative bright field images (5×) of paraffin sections with tumor (CA) and normal adjacent (NA) tissue from 8 ER+ tumors, 6 HER2+ tumors and 6 triple negative (TN) tumors stained for CD36. (C) Average and SEM of CD36 signal per cell for each tumor subtype. (D) Left panels: representative bright field images (20×) of paraffin sections from 21 LD and 14 HD ER+ IDC patients stained for CD36. Right panel: average and SEM of CD36 signal per cell.
Figure 7
Figure 7. CD36 expression in tissue adjacent and distal to the tumor
(A–C) Left panels: representative bright field images (20×) of paraffin sections with tumor (CA) and normal adjacent (NA) tissue or with normal distal (ND) tissue from 3 mastectomies stained for CD36. Right panels: average and SEM of CD36 signal per cell.

Comment in

  • Desmoplasia: a response or a niche?
    DeClerck YA. DeClerck YA. Cancer Discov. 2012 Sep;2(9):772-4. doi: 10.1158/2159-8290.CD-12-0348. Cancer Discov. 2012. PMID: 22969116
  • Microenvironment: A dense danger.
    Burgess DJ. Burgess DJ. Nat Rev Cancer. 2012 Oct;12(10):656-7. doi: 10.1038/nrc3375. Epub 2012 Sep 21. Nat Rev Cancer. 2012. PMID: 22996600 No abstract available.

References

    1. Kalluri R, Zeisberg M. Fibroblasts in cancer. Nat Rev Cancer. 2006;6:392–401. - PubMed
    1. Arendt LM, Rudnick JA, Keller PJ, Kuperwasser C. Stroma in breast development and disease. Semin Cell Dev Biol. 2010;21:11–18. - PMC - PubMed
    1. Finak G, Bertos N, Pepin F, Sadekova S, Souleimanova M, Zhao H, et al. Stromal gene expression predicts clinical outcome in breast cancer. Nat Med. 2008;14:518–527. - PubMed
    1. Tlsty TD, Coussens LM. Tumor stroma and regulation of cancer development. Annu Rev Pathol. 2006;1:119–150. - PubMed
    1. Olumi AF, Grossfeld GD, Hayward SW, Carroll PR, Tlsty TD, Cunha GR. Carcinoma-associated fibroblasts direct tumor progression of initiated human prostatic epithelium. Cancer Res. 1999;59:5002–5011. - PMC - PubMed

Publication types