. 2012 Oct;2(10):906-21.
doi: 10.1158/2159-8290.CD-12-0085. Epub 2012 Jul 9.

VEGF/neuropilin-2 regulation of Bmi-1 and consequent repression of IGF-IR define a novel mechanism of aggressive prostate cancer

Affiliations

VEGF/neuropilin-2 regulation of Bmi-1 and consequent repression of IGF-IR define a novel mechanism of aggressive prostate cancer

Hira Lal Goel et al. Cancer Discov. 2012 Oct.

Abstract

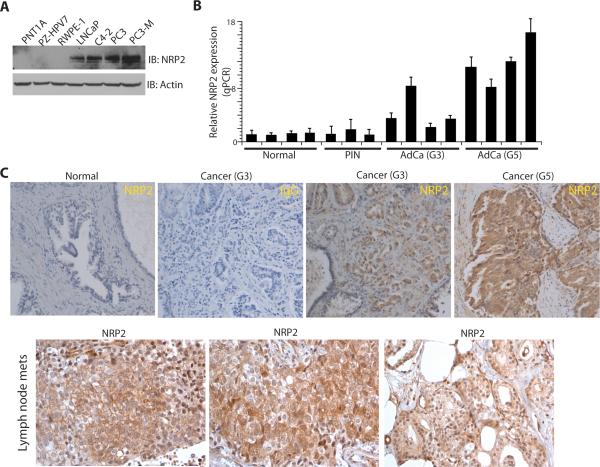
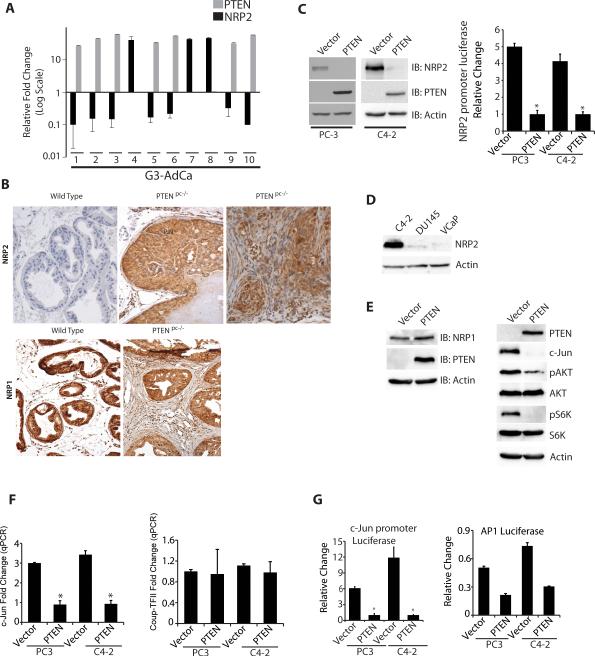
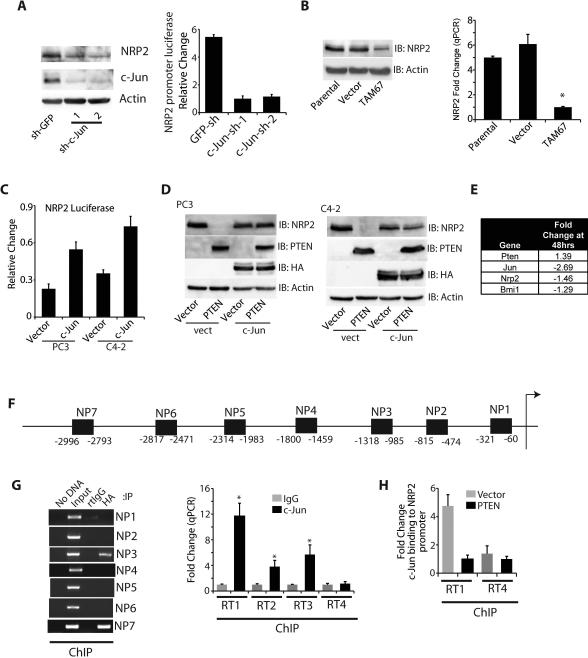
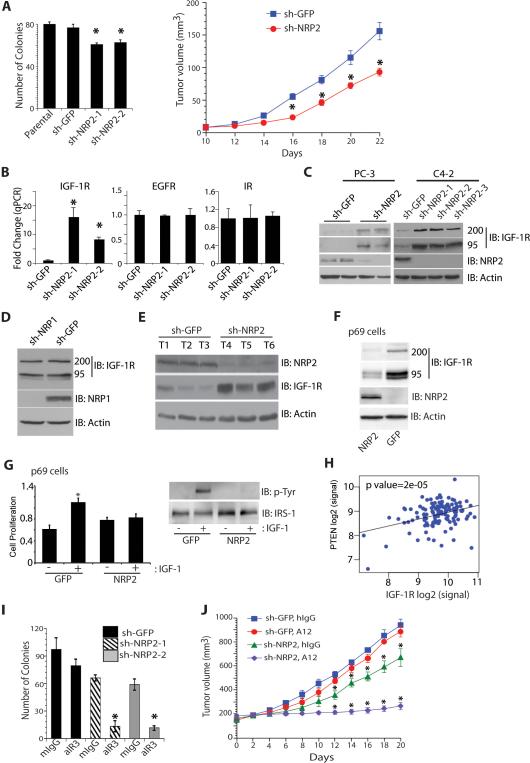
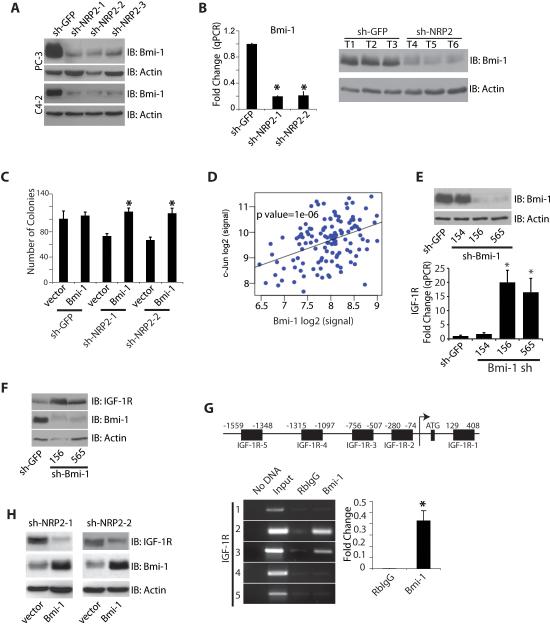
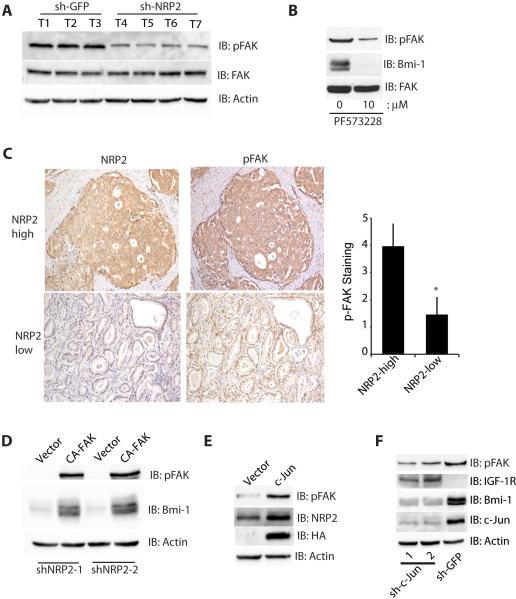
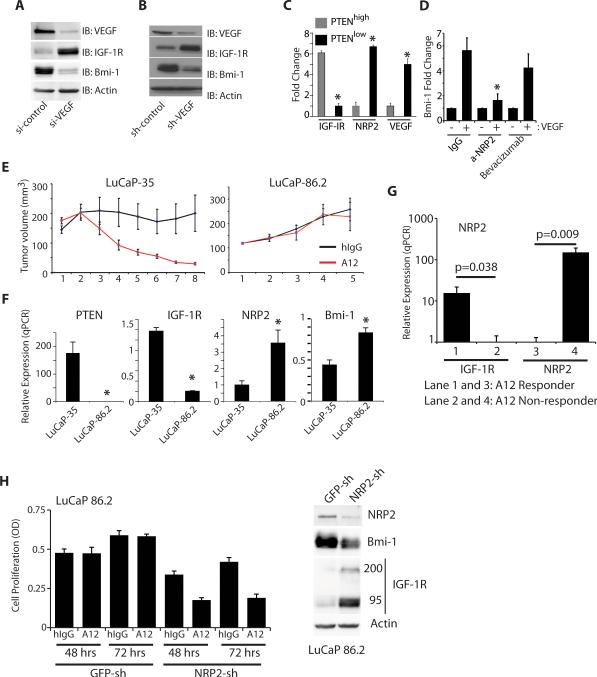
We show that the VEGF receptor neuropilin-2 (NRP2) is associated with high-grade, PTEN-null prostate cancer and that its expression in tumor cells is induced by PTEN loss as a consequence of c-Jun activation. VEGF/NRP2 signaling represses insulin-like growth factor-1 receptor (IGF-IR) expression and signaling, and the mechanism involves Bmi-1-mediated transcriptional repression of the IGF-IR. This mechanism has significant functional and therapeutic implications that were evaluated. IGF-IR expression positively correlates with PTEN and inversely correlates with NRP2 in prostate tumors. NRP2 is a robust biomarker for predicting response to IGF-IR therapy because prostate carcinomas that express NRP2 exhibit low levels of IGF-IR. Conversely, targeting NRP2 is only modestly effective because NRP2 inhibition induces compensatory IGF-IR signaling. Inhibition of both NRP2 and IGF-IR, however, completely blocks tumor growth in vivo.


Figures

Figure 1
Figure 1. Neuropilin-2 expression is associated with prostate cancer progression
(A) Normal (PNT1A, PZ-HPV7 and RWPE-1) or prostate cancer (LNCaP, C4-2, PC3 and PC3M) cell lines were immunoblotted using Abs to NRP2 or actin. (B) Expression of NRP2 mRNA was quantified by qPCR in microdissected sections from normal glands, PIN, grade 3 and grade 5 prostate cancer specimens. (C) Specimens of normal prostate gland, Gleason grade 3 and grade 5 carcinoma and lymph node metastases were immunostained with a NRP2 Ab or a control IgG.
Figure 2
Figure 2. PTEN loss induces NRP2 and c-Jun
(A) Microdissected specimens of tumor cells from Gleason grade 3 prostate cancer specimens were analyzed for NRP2 and PTEN expression by qPCR. (B) Wild-type or PTENpc−/− prostates [PIN (6 wks) and carcinoma (20 wks)] were stained with either a NRP2 or a NRP1 Ab. NRP2 expression was not detected in the wild-type prostate (n=4), but there is significant NRP2 expression in PIN lesions and carcinomas of PTENpc−/− mice (n=4). In contrast, NRP1 is expressed in both normal prostate epithelium and carcinomas. (C) PC3 or C4-2 cells were transfected with either a PTEN-expressing vector or vector control, and extracts were immunoblotted for PTEN, NRP2 and actin (left blot). These cells were also transfected with a luciferase reporter construct containing the NRP2 promoter. Luciferase activity was measured and normalized to Renilla (right graph). (D) Extracts from C4-2, VCaP and DU145 cells were immunoblotted for NRP2 and actin. (E) PC3 cells were transfected with either a PTEN-expressing vector or vector control, and extracts were immunoblotted for PTEN, NRP1 and actin (left blot) or for key signaling molecules (right blot). (F) PC3 or C4-2 cells were transfected with either a PTEN-expressing vector or vector control, and the expression of c-Jun (left graph) and Coup-TFII mRNA (right graph) was quantified by qPCR. (G) PC3 or C4-2 cells expressing either PTEN or vector control were transfected with reporter constructs containing either the c-Jun promoter or AP1 reporter. Luciferase activity was measured and normalized to Renilla.
Figure 3
Figure 3. c-Jun regulates NRP2 expression
(A) PC3 cells were transfected with either a GFP-shRNA or two independent c-Jun shRNAs (1 and 2), and extracts were immunoblotted for NRP2, c-Jun and actin (left blot). A NRP2 promoter reporter construct was expressed in these cells and luciferase activity was normalized to Renilla (right graph). (B) PC3 cells were transfected with either TAM67 (a dominant negative c-Jun construct) or vector control. Extracts were immunoblotted for NRP2 and actin (left blot), and NRP2 mRNA expression was quantified by qPCR (right graph). (C) A c-Jun expression vector or control was expressed in either PC3 or C4-2 cells along with a NRP2 promoter reporter construct, and luciferase activity was normalized to Renilla. (D) PC3 or C4-2 cells expressing either PTEN or vector control were transfected with c-Jun (HA tagged) and protein extracts were immunoblotted for NRP2, PTEN, HA and actin. (E) Variation in the expression of PTEN, c-Jun, NRP2 and Bmi-1 upon PTEN induction (48 hours) in Pten−/− cells as described in Results. (F) Schematic representation of the NRP2 promoter. The arrow indicates the transcriptional start site. Highlighted boxes (NP1-7) represent the primers used to amplify the ChIP DNA using semi-quantitative PCR in G. (G) PC3 cells were transfected with an HA-c-Jun construct and ChIP was performed using an HA antibody or rat IgG to identify c-Jun binding sites on the NRP2 promoter. The precipitated DNA was amplified by PCR using primers specific for NP regions 1 to 7 (left gel) and the results were quantified by qPCR (right graph). The RT1-4 primers used for qPCR described in Figure S8. (H) The effect of PTEN expression on c-Jun binding to the NRP2 promoter was assessed by ChIP and quantified by qPCR.
Figure 4
Figure 4. NRP2 represses IGF-IR expression and signaling
(A) PC3 cells were either not transfected (parental) or transfected with either a GFP-shRNA (sh-GFP) or two independent NRP2 shRNAs (sh-NRP2-1 and sh-NRP2-2) and analyzed for growth in soft agar (left graph). These transfectants (sh-GFP or sh-NRP2) were implanted in immunocompromised mice and xenograft growth was measured on alternate days (n=8) (right graph). (B) Expression of IGF-IR, EGFR and insulin receptor (IR) mRNA was quantified in PC3 transfectants (sh-GFP, sh-NRP2-1 and sh-NRP2-2) by qPCR. (C) Extracts from PC3 (sh-GFP or sh-NRP2) and C4-2 (sh-GFP or sh-NRP2) transfectants were immunoblotted for IGF-IR, NRP2 and actin. (D) Extracts from PC3 transfectants (GFP-sh or NRP1-sh) were immunoblotted for IGF-IR, NRP1 and actin. (E) Extracts from PC3 xenograft tumors (sh-GFP or sh-NRP2) were immunoblotted for NRP2, IGF-IR and actin. (F-G) Prostate epithelial cells (p69) were transfected with either NRP2 or GFP, and extracts were immunoblotted for IGF-1R, NRP2 and actin (F). These transfectants were also analyzed for cell proliferation in response to IGF-1 using the MTT assay (middle graph). They were also serum-deprived for 12 hours and stimulated with IGF-1 (50 ng/ml) for 10 minutes. Cell extracts were used to immunoprecipitate IRS-1 and immunoblotted for phospho-tyrosine (p-Tyr) or IRS-1 (right blot). (H) A significant correlation (p value is 2 × 10⁻⁵) in expression of PTEN and IGF-1R was observed in human prostate specimens (n=128) as described in results. (I) PC3 transfectants (sh-GFP, sh-NRP2-1 and sh-NRP2-2) were analyzed for anchorage-independent growth in the presence of either hIgG or an IGF-IR Ab (αIR3, 1 mg/ml). (J) PC3 transfectants (sh-GFP, or sh-NRP2) were implanted in immuno-compromised mice. Mice were injected i.p. with either A12 (IGF-1R Ab) or IgG (40 mg/kg, thrice a week), once the tumor volume reached ~150mm3. Xenograft growth was measured on alternate days. Two groups of mice (sh-NRP2 + hIgG and NRP2sh + A12) exhibited significant inhibition of tumor growth compared to the remaining two groups (GFPsh, hIgG and GFP-sh, A12). *p-value is less than 0.05. Eight tumors were analyzed for each group.
Figure 5
Figure 5. NRP2 sustains expression of Bmi-1, which represses IGF-1R transcription
(A-B) Bmi-1 expression was evaluated in PC3 and C4-2 transfectants (sh-GFP, sh-NRP2-1, sh-NRP2-2 and sh-NRP2-3) by immunoblotting (A) and qPCR (B, left graph). Extracts from PC3 xenograft tumors (sh-GFP or sh-NRP2) were immunoblotted for Bmi-1 and actin (B, right blot). (C) PC3 transfectants (sh-GFP, sh-NRP2-1 or sh-NRP2-2) were infected with lentivirus particles expressing either GFP or Bmi-1 and analyzed for growth in soft agar. Expression of Bmi-1 increases anchorage-independent growth. (D) A significant correlation (p value is 1 × 10⁻⁶) in the expression of c-Jun and Bmi-1 was observed in human prostate specimens (n=128) as described in results. (E) PC3 transfectants (sh-GFP or sh-Bmi-1) cells were immunoblotted for Bmi-1 and actin (upper blot). PC3 transfectants (sh-GFP, sh-Bmi-154, sh-Bmi-156 and sh-Bmi-565) were analyzed for IGF-1R mRNA by qPCR. Note: sh-Bmi-1-154 did not decrease Bmi-1 expression and showed no effect on IGF-1R mRNA (lower graph). (F) PC3 transfectants (sh-GFP, sh-Bmi-156 and sh-Bmi-565) were immunoblotted for Bmi-1, IGF-1R and actin. (G) ChIP analysis of Bmi-1 binding to the IGF-1R promoter. A schematic of the IGF-1R promoter with highlighted boxes (IGF-1R-1-5) representing the primers used to amplify the ChIP DNA by semi-quantitative PCR. The arrow indicates the transcriptional start site and ATG indicates the translation start codon. ChIP was performed using a Bmi-1 antibody or rabbit IgG and precipitated DNA was amplified by PCR using primers specific for regions 1 to 5. Bmi-1 binding to the IGF-1R promoter was confirmed by qPCR. (H) PC3 transfectants (sh-NRP2-1 and sh-NRP2-2) were infected with lentivirus particles expressing either GFP or Bmi-1, and extracts were immunoblotted for IGF-1R, Bmi-1 and actin.
Figure 6
Figure 6. FAK mediates NRP2-stimulated Bmi-1 expression
(A) Extracts from PC3 xenograft tumors (sh-GFP or sh-NRP2) were immunoblotted for pFAK (pY397), total FAK and actin. (B) PC3 cells were incubated with a FAK inhibitor PF573228 (10 μM), and extracts were immunoblotted for pFAK, Bmi-1 and FAK. (C) Human prostate cancer specimens (n=24) were immunostained for NRP2 and pFAK (pY397). NRP2 staining was scored as either low (score 0 or 1) or high (score 2-5). pFAK staining was scored at a scale of 1 to 5. The graph summarizes the intensity of pFAK in NRP2-low and NRP2-high tumors. There is significantly higher pFAK in the NRP2-high tumors than in the NRP2-low tumors (p= 0.00004). (D) PC3 transfectants (sh-NRP2-1 and sh-NRP2-2) were transfected with either CA-FAK (K38A) or vector alone, and extracts were immunoblotted for pFAK (pY397), Bmi-1 and actin. (E) LNCaP cells were transfected with either c-Jun or vector, and immunoblotted for pFAK (pY397), NRP2, HA and actin. (F) PC3 cells were transfected with c-Jun shRNAs (1 and 2) or a GFP shRNA, and immunoblotted for pFAK (pY397), IGF-1R, c-Jun, Bmi-1 and actin.
Figure 7
Figure 7. VEGF regulates Bmi-1 and IGF-1R expression
(A-B) PC3 cells were either transfected with VEGF siRNA Smartpool (A) or infected with a VEGF shRNA (B). Extracts were immunoblotted for VEGF, NRP2, Bmi-1 and actin. (C) Microdissected tumor cells from PTENhigh (n=6) or PTENlow (n=6) prostate cancer specimens were analyzed for VEGF, NRP2 and IGF-1R mRNA expression by qPCR. PTEN expression correlates positively with IGF-1R, and negatively with NRP2 and VEGF expression. (D) PC3 cells expressing sh-VEGF were incubated with VEGF in the presence of control IgG, a NRP2 Ab or bevacizumab. Cells were analyzed for expression of Bmi-1 by qRT-PCR. NRP2 expression predicts response to IGF-1R therapy (E-H). (E) Graphs display the volume of LuCaP xenograft tumors (+/− SEM) of 10 castrated mice after A12 or human IgG treatment. (F) LuCaP xenografts (35 and 86.2) were analyzed for IGF-1R, NRP2, PTEN and Bmi-1 expression by qPCR. The A12 non-responder (86.2, PTEN-null) had significantly higher NRP2 and Bmi-1 expression than did the A12 responder. *p-value is less than 0.05. (G) IGF-1R and NRP2 expression was quantified by qPCR in 15 A-12 responder and 8 non-responder LuCaP xenografts. Data show 150-fold more NRP2 expression in the non-responders compared to responders and only a 10-fold increase in IGF-1R expression in the responders compared to the non-responders. (H) Freshly isolated cells from LuCaP 86.2 tumors were infected with lentivirus expressing either sh-GFP or sh-NRP2. Cell proliferation was measured in the presence of either hIgG or A12 up to 72 hours using MTT assay (left graph) and the expression of NRP2, Bmi-1 and IGF-1R was assessed by immunoblotting (right blot).

Similar articles

Cited by

References

    1. Siegel R, Ward E, Brawley O, Jemal A. Cancer statistics, 2011: The impact of eliminating socioeconomic and racial disparities on premature cancer deaths. CA Cancer J Clin. 2011;61:212–36. - PubMed
    1. Bachelder RE, Crago A, Chung J, Wendt MA, Shaw LM, Robinson G, et al. Vascular endothelial growth factor is an autocrine survival factor for neuropilin-expressing breast carcinoma cells. Cancer Res. 2001;61:5736–40. - PubMed
    1. Lichtenberger BM, Tan PK, Niederleithner H, Ferrara N, Petzelbauer P, Sibilia M. Autocrine VEGF signaling synergizes with EGFR in tumor cells to promote epithelial cancer development. Cell. 2010;140:268–79. - PubMed
    1. Muders MH, Zhang H, Wang E, Tindall DJ, Datta K. Vascular endothelial growth factor-C protects prostate cancer cells from oxidative stress by the activation of mammalian target of rapamycin complex-2 and AKT-1. Cancer Res. 2009;69:6042–8. - PMC - PubMed
    1. Beck B, Driessens G, Goossens S, Youssef KK, Kuchnio A, Caauwe A, et al. A vascular niche and a VEGF-Nrp1 loop regulate the initiation and stemness of skin tumours. Nature. 2011;478:399–403. - PubMed

Publication types

MeSH terms