. 2012 Sep;32(18):3663-80.
doi: 10.1128/MCB.00406-12. Epub 2012 Jul 9.

RAD51 mutants cause replication defects and chromosomal instability

Affiliations

RAD51 mutants cause replication defects and chromosomal instability

Tae Moon Kim et al. Mol Cell Biol. 2012 Sep.

Abstract

RAD51 is important for restarting stalled replication forks and for repairing DNA double-strand breaks (DSBs) through a pathway called homology-directed repair (HDR). However, analysis of the consequences of specific RAD51 mutants has been difficult since they are toxic. Here we report on the dominant effects of two human RAD51 mutants defective for ATP binding (K133A) or ATP hydrolysis (K133R) expressed in mouse embryonic stem (ES) cells that also expressed normal mouse RAD51 from the other chromosome. These cells were defective for restarting stalled replication forks and repairing breaks. They were also hypersensitive to camptothecin, a genotoxin that generates breaks specifically at the replication fork. In addition, these cells exhibited a wide range of structural chromosomal changes that included multiple breakpoints within the same chromosome. Thus, ATP binding and hydrolysis are essential for chromosomal maintenance. Fusion of RAD51 to a fluorescent tag (enhanced green fluorescent protein [eGFP]) allowed visualization of these proteins at sites of replication and repair. We found very low levels of mutant protein present at these sites compared to normal protein, suggesting that low levels of mutant protein were sufficient for disruption of RAD51 activity and generation of chromosomal rearrangements.


Figures
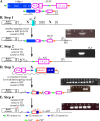
Fig 1
Fig 1
High-throughput knock-in at MmRad51. (A) The SAβgeo-miniHPRT selection cassette. SAβgeo is a fusion of β-galactosidase and neomycin phosphotransferase genes with a splice acceptor (SA) instead of a promoter so that cells will survive G418 selection only if a promoter/splice donor is trapped (20). miniHPRT (hypoxanthine phosphoribosyltransferase) (24, 51) is commonly used to select for transfected ES cells previously mutated for Hprt and offers an advantage over other selection cassettes in that one may select for either its presence in HAT (hypoxanthine, aminopterin, thymidine) or its absence in 6-thioguanine (6-TG). miniHPRT has a phosphoglycerate kinase (PGK) promoter (1) and an intron that separates the coding sequence from exons 1 and 2 to exons 3 to 8. An RE mutant lox (2) is in the intron. In addition, another RE mutant lox is 5′ to SAβgeo. An FRT is at the 3′ end of miniHPRT. (B) Replacement of MmRad51 exons 2 to 4 (exon 2 is the first coding exon) with the SAβgeo-miniHPRT selection cassette. PCR is used to screen G418-HAT-resistant ES cell clones for gene targeting (clone 2) using primers H13F and SR3. (C) Removal of SAβgeo, the 5′ half of miniHPRT and a RE mutant lox by Cre-mediated recombination selected by 6-TG resistance. Correct recombinant clones were identified by PCR screening using primers RCF1 and AS2. (D) Knock-in of wild-type HsRAD51 cDNA by Cre-mediated recombination. The Cre-mediated targeting vector contains the 5′ half of miniHPRT, an LE mutant lox, an FRT, and the cDNA (with a Kozak ATG [30], shown as a red box, and SV40 polyadenylation sequences, shown as a dark blue box) with endogenous splicing sequences (light blue area shown in panel B). HAT was used to select for miniHPRT restoration, with correct integration screened by PCR (top panel with black half-arrow primers; lanes 1 and 10 are negative controls, and lanes 2 to 11 are all knock-ins) and RT-PCR (bottom panel with red half-arrow primers; lanes 1 to 4 are negative controls, and lanes 5 and 6 are knock-ins). (E) Removal of bacterial backbone, miniHPRT, one FRT, and the wild-type loxP by FLP recombinase. Screen TG-resistant clones by PCR (black half-arrow primers; lanes 1 and 7 are negative controls, and lanes 2 to 6 have had the sequences removed).
Fig 2
Fig 2
Expression of HsRAD51 K133 mutants reduces colony number and size. (A) Ratios of HAT-resistant colonies were compared for HsRAD51WT (WT) and the negative control (KS) to HsRAD51K133A (KA) and HsRAD51K133R (KR) with and without eGFP. Shown is the total number of HAT-resistant colonies observed from four experiments for the untagged Cre-mediated knock-in plasmids. Colony numbers are listed in sequential order from the first to the fourth experiment, and some of plasmids were not examined (shown by “ND” [not done]) for some experiments: HsRAD51WT, 337, 262, 106, and 208; KS, 337, ND, ND, and 123; HsRAD51K133A, 20, 26, ND, and ND; HsRAD51K133R, 84, 100, 18, and ND. The total numbers of HAT-resistant colonies observed from three experiments for the eGFP-tagged Cre-mediated knock-in plasmids are as follows: eGFP-HsRAD51WT, 52, 227, and 261; eGFP-HsRAD51K133A, 7, 19, and 20; and eGFP-HsRAD51K133R, 15, 75, and 76. AB2.2 cells are shown. (B) Surface area of HAT-resistant colonies after knock-in. The total numbers of colonies observed are as follows: HsRAD51WT, 8; KS, 8; HsRAD51K133A, 7; and HsRAD51K133R, 8. AB2.2 cells are shown. (C) RT-PCR on cells expressing untagged HsRAD51. AB2.2 cells are the control (Con). (D) Western analysis of nuclear extracts using anti-RAD51 antibody on cells expressing eGFP-HsRAD51. AB2.2 cells are the control. (E) Nonspecific eGFP-HsRAD51 and MmRad51 shRNA knockdown. The total colony numbers are shown. (F) MmRad51-specific shRNA knockdown. Three experiments were performed. The number of colonies that grow after stable transfection of shRNA plasmid is divided by the number of colonies that grow after stable transfection of empty vector for cells that express the following: eGFP-HsRAD51WT, 98/188, 103/180, and 99/176; eGFP-HsRAD51K133A, 14/118, 17/144, and 15/106; and eGFP-HsRAD51K133R, 15/110, 15/118, and 16/114. AB2.2 cells are shown. (G) Western analysis after no transfection (NT) or transfection with empty vector (EV) or shRNA for MmRad51. Two clones were observed for cells that express eGFP-HsRAD51WT in AB2.2 cells. α-HsRAD51, anti-HsRAD51; α-β-actin, anti-β-actin.
Fig 3
Fig 3
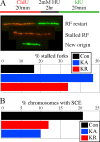
Replication fork restart and sister chromatid exchanges. Control is unaltered AB2.2 cells. (A) Microfiber analysis to observe replication fork restart. The experimental design is shown at the top, and DNA fibers shown in the middle illustrate replication forks (RFs) that have restarted (red-black-green), stalled (red), or initiated from a new origin (green). Shown is a quantification of the percentage of fibers that were stalled after exposure to 2 mM HU for 2 h (bottom). The numbers of fibers observed that were stalled, restarted, or from a new origin, respectively, are as follows: control, 69, 351, and 5; HsRAD51K133A, 267, 288, and 19; and HsRAD51K133R, 264, 515, and 9. (B) Graph depicting the percentage of chromosomes observed to undergo spontaneous SCEs. The total number of SCEs and total number of chromosomes, respectively, observed are as follows: control, 197 and 945; HsRAD51K133A, 234 and 1,927; and HsRAD51K133R, 153 and 1,572.
Fig 4
Fig 4
Dose response to topoisomerase inhibitors. In Lex1 cells, the dose response to camptothecin (CPT) (A) and ICRF-193 (B) were determined using a cell survival assay that counts both replicating and nonreplicating cells (39). Lex1 unaltered cells are the control. These graphs represent the average of three experiments. (C) Comparison of eGFP-tagged and untagged proteins using a colony-forming assay for AB2.2 cells that express WT (left), KA (middle), or KR (right). Shown is the average of three experiments. The control (+/−) is the same for all three graphs and can be used as a standard for comparison.
Fig 5
Fig 5
The ATR response as measured by CHK1 phosphorylation. No treatment (NT) is compared to the time in hours after release (R) from camptothecin (100 nM, 16 h). Compared are the levels of total CHK1 to phosphorylated CHK1 (p-CHK1).
Fig 6
Fig 6
Evaluation of metaphase spreads (MPS) for spontaneous chromosomal abnormalities in Lex1 (A to C) and AB2.2 (D to G) cells. (A) Chromatid breaks in the long arm (blue). (B) Isochromatid breaks (left) in the pericentromere (red). (C) Fragments containing the pericentromere (red). (D) Radial. (E) An EPT-1. (F) An EPT-2. (G) SKY analysis. (Row 1) der(11)fusion. This is an EPT. (Row 2) Duplication 1 der(1)t(1:6). This is likely an EPT. (Row 3) der(3)t(3:5). (Row 4) der(5)t(5:3). (Row 5) der(8)t(8:14). This may be an EPT but is difficult to discern. (Row 6) Duplication 2.
Fig 7
Fig 7
Analysis of LOH in AB2.2 cells that express HsRAD51 (WT, K133A, and K133R). (A) The percentage of colonies that survived in 6-TG. The numbers of 6-TG-resistant colonies from three replica plates are as follows: KS, 12, 14, and 13; HsRAD51WT, 16, 12, and 10; HsRAD51K133A, 2,038, 2,457, and 2,558; and HsRAD51K133R, 911, 951, and 951. The numbers of colonies that grew without selection are as follows: KS, 55,800; HsRAD51WT, 95,800; HsRAD51K133A, 78,000; and HsRAD51K133R, 57,600. Statistics (t test): 1 versus 2, 0.062; 1 versus 3, 0.0047; 1 versus 4, 0.0002; 2 versus 3, 0.0046; 2 versus 4, 0.0002; and 3 versus 4, 0.0167. (B) Location of primers for PCR analysis to detect the presence/absence of the HsRAD51 cDNA (blue half-arrows) and miniHPRT (red half-arrows). The total numbers of 6-TG resistant colonies observed are as follows: WT, 8; KS, 7; KA, 10; and KR, 10. (C) The percentage of metaphase spreads that contain the number of chromosomes shown on the x axis. The inset shows the total percentages of metaphase spreads with <40, 40, and >40 chromosomes, showing there is more chromosome loss than gain. The total numbers of metaphase spreads observed are as follows: WT, 147; KA, 144; and KR, 129.
Fig 8
Fig 8
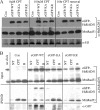
Protein localization. AB2.2 cells that express eGFP-HsRAD51WT, eGFP-HsRAD51K133A, or eGFP-HsRAD51K133R. (A) Chromatin fraction. Screened with anti-HsRAD51 (α-HsRAD51) antibody to detect eGFP-HsRAD51 (top) and MmRAD51 (bottom). Histone H3 is the loading control. α-H3, anti-histone H3. (B) Observation of proteins on or adjacent to the nascent replication strand. Input screened with anti-HsRAD51 antibody (top). Shown are purified nascent DNA-protein complexes screened with anti-HsRAD51 antibody (middle) or with anti-GFP antibody (bottom). NT, no treatment; R, release.
Fig 9
Fig 9
Spontaneous and CPT-induced foci in AB2.2 cells. (A) Graph showing the fraction of cells that exhibit green foci before and after 3 h of exposure to 1 μM CPT. The total numbers of cells observed before and after CPT, respectively, are as follows: eGFP-WT, 162 and 154; eGFP-KA, 112 and 87; and eGFP-KR, 199 and 253. (B) Graph showing the fraction of cells that exhibit red foci after 3 h of exposure to 1 μM CPT. The same cells were observed as for the green foci shown in panel A. (C) Cells expressing eGFP-HsRAD51WT after 3 h of exposure to 1 μM CPT. Panel 1, merge; panel 2, anti-HsRAD51 antibody; panel 3, green fluorescence; panel 4, DAPI.

Similar articles

Cited by

References

    1. Adra CN, Boer PH, McBurney MW. 1987. Cloning and expression of the mouse pgk-1 gene and the nucleotide sequence of its promoter. Gene 60:65–74 - PubMed
    1. Araki K, Araki M, Yamamura K. 1997. Targeted integration of DNA using mutant lox sites in embryonic stem cells. Nucleic Acids Res. 25:868–872 - PMC - PubMed
    1. Araki K, Okada Y, Araki M, Yamamura K. 2010. Comparative analysis of right element mutant lox sites on recombination efficiency in embryonic stem cells. BMC Biotechnol. 10:29 doi:10.1186/1472-6750-10-29 - DOI - PMC - PubMed
    1. Badie S, et al. 2010. BRCA2 acts as a RAD51 loader to facilitate telomere replication and capping. Nat. Struct. Mol. Biol. 17:1461–1469 - PMC - PubMed
    1. Bailey JA, Eichler EE. 2006. Primate segmental duplications: crucibles of evolution, diversity and disease. Nat. Rev. Genet. 7:552–564 - PubMed

Publication types