. 2012 Aug 31;287(36):30305-16.
doi: 10.1074/jbc.M112.394122. Epub 2012 Jul 9.

Extracellular Ca(2+) sensing in salivary ductal cells

Affiliations

Extracellular Ca(2+) sensing in salivary ductal cells

Bidhan C Bandyopadhyay et al. J Biol Chem. .

Abstract

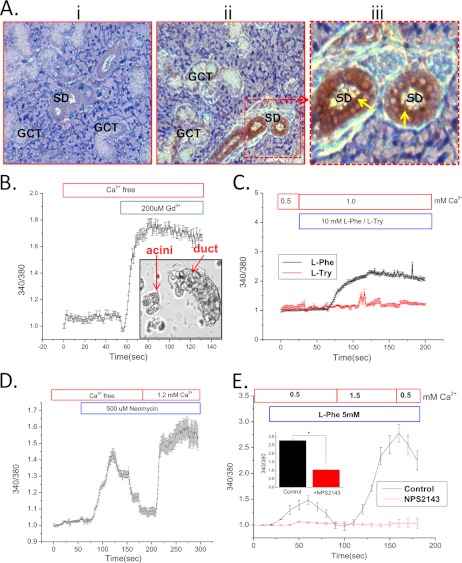
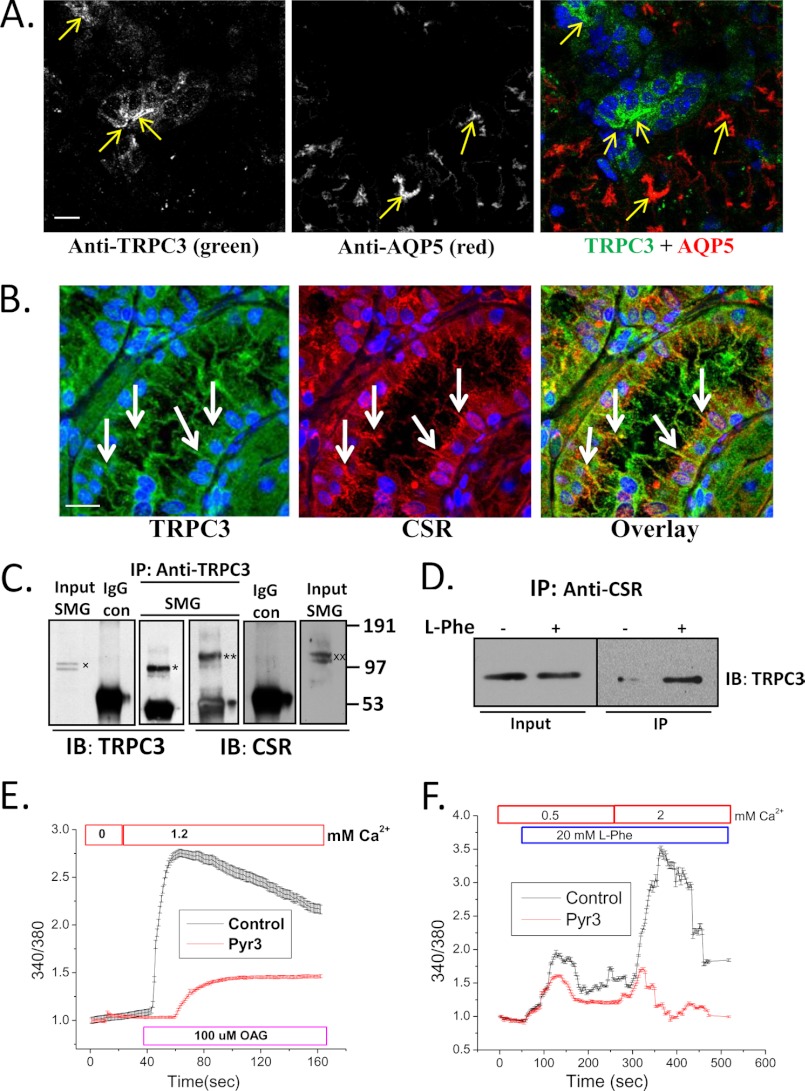
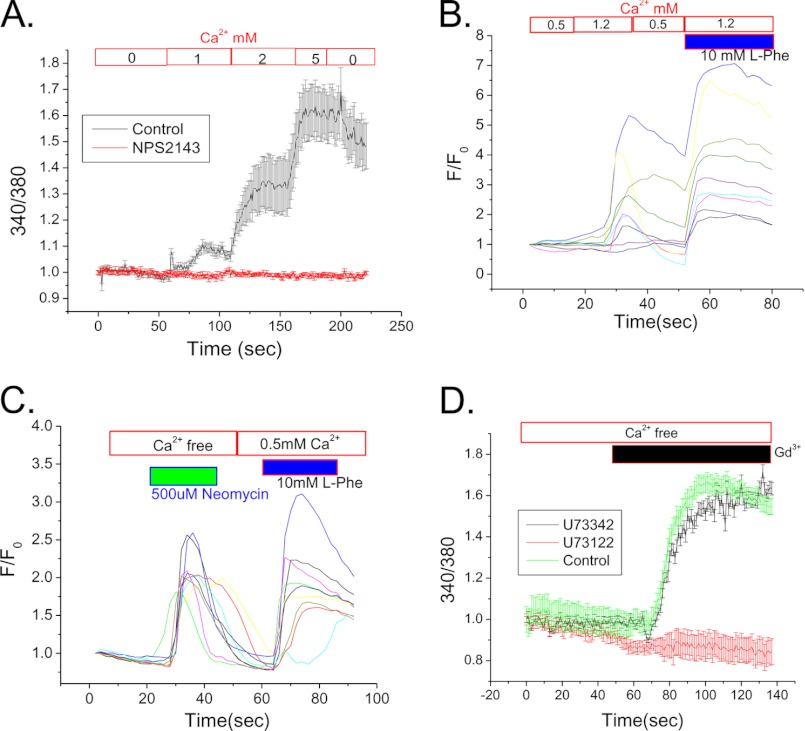
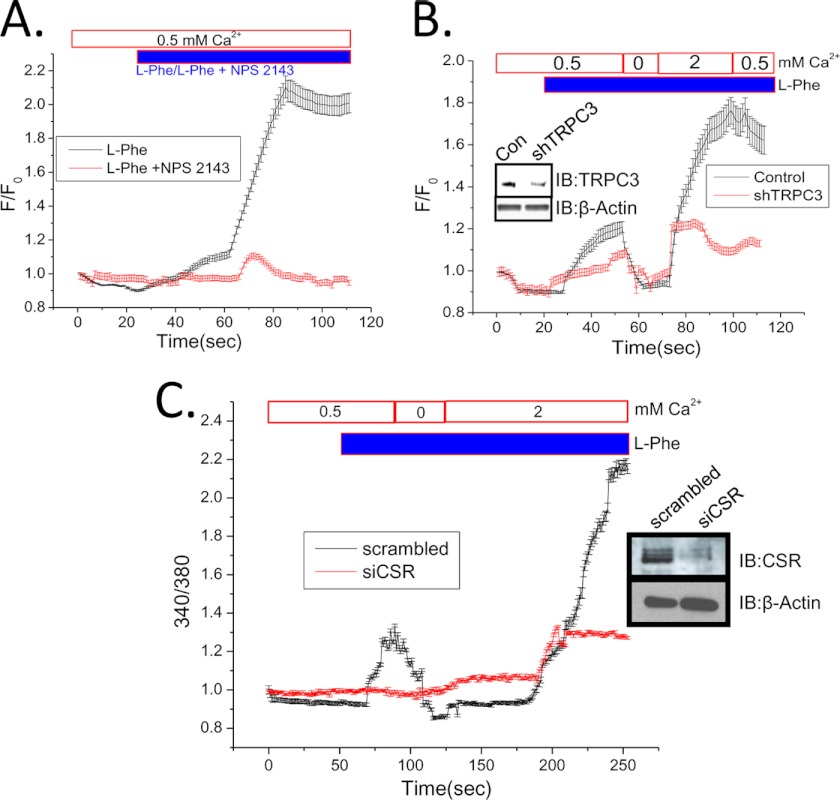
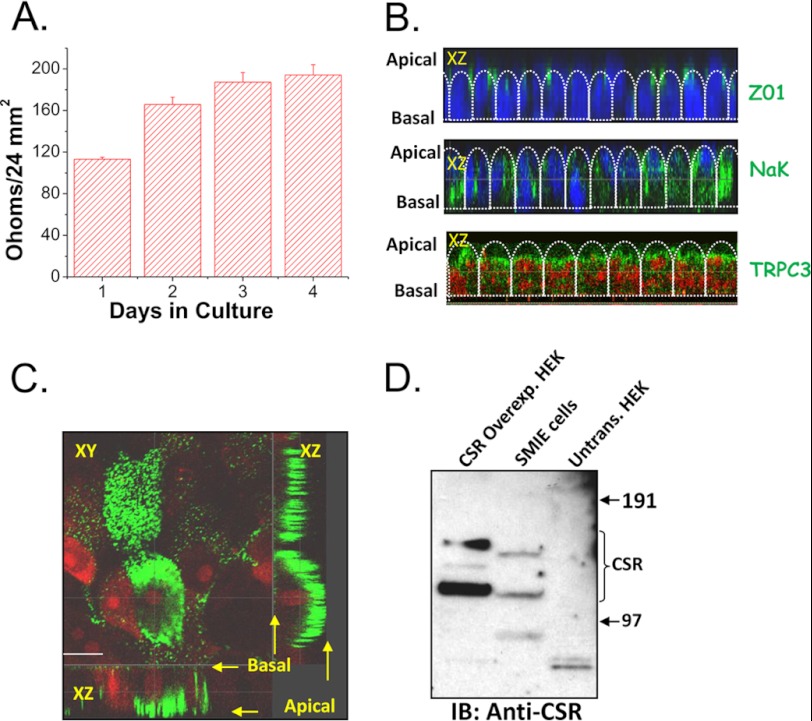
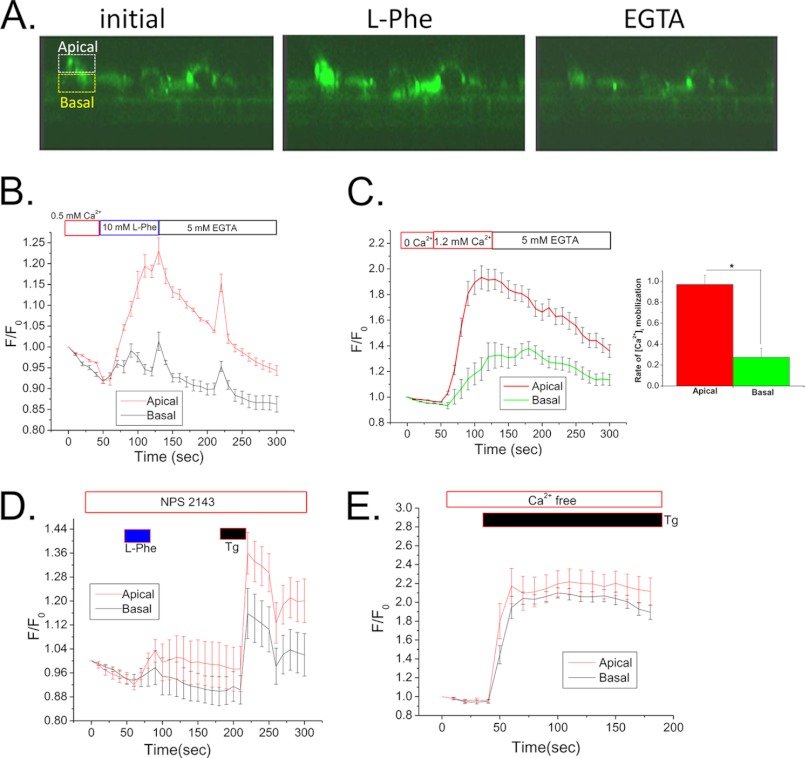
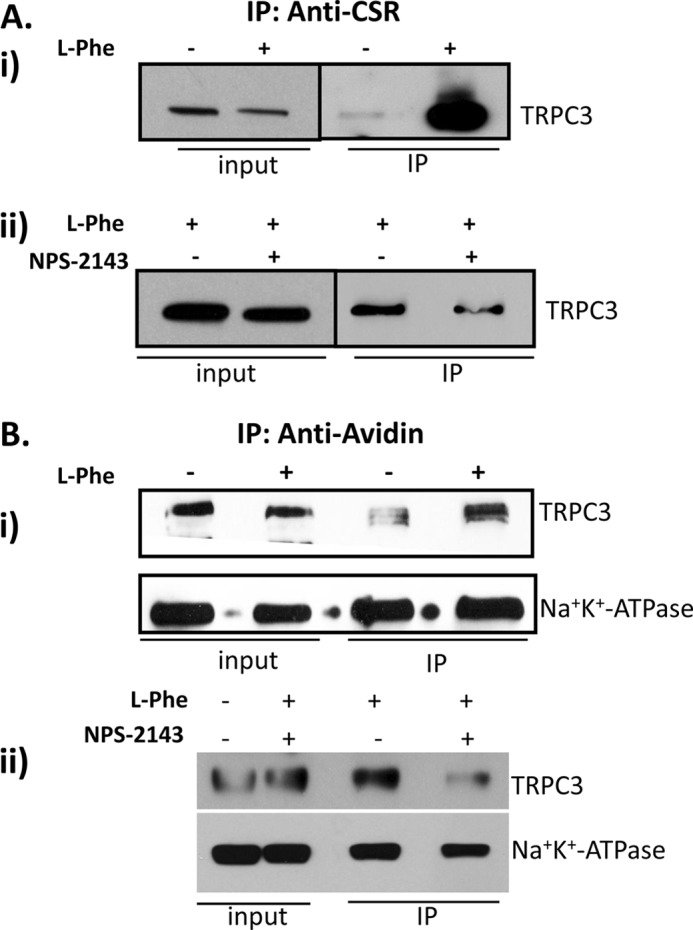
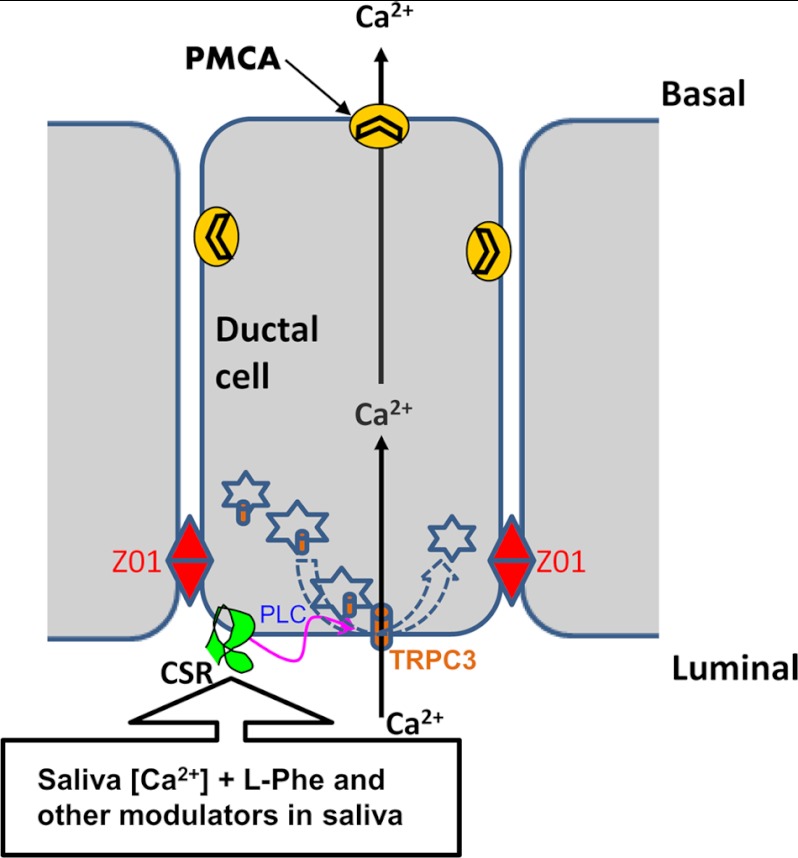
Ca(2+) is secreted from the salivary acinar cells as an ionic constituent of primary saliva. Ions such as Na(+) and Cl(-) get reabsorbed whereas primary saliva flows through the salivary ductal system. Although earlier studies have shown that salivary [Ca(2+)] decreases as it flows down the ductal tree into the oral cavity, ductal reabsorption of Ca(2+) remains enigmatic. Here we report a potential role for the G protein-coupled receptor, calcium-sensing receptor (CSR), in the regulation of Ca(2+) reabsorption by salivary gland ducts. Our data show that CSR is present in the apical region of ductal cells where it is co-localized with transient receptor potential canonical 3 (TRPC3). CSR is activated in isolated salivary gland ducts as well as a ductal cell line (SMIE) by altering extracellular [Ca(2+)] or by aromatic amino acid, L-phenylalanine (L-Phe, endogenous component of saliva), as well as neomycin. CSR activation leads to Ca(2+) influx that, in polarized cells grown on a filter support, is initiated in the luminal region. We show that TRPC3 contributes to Ca(2+) entry triggered by CSR activation. Further, stimulation of CSR in SMIE cells enhances the CSR-TRPC3 association as well as surface expression of TRPC3. Together our findings suggest that CSR could serve as a Ca(2+) sensor in the luminal membrane of salivary gland ducts and regulate reabsorption of [Ca(2+)] from the saliva via TRPC3, thus contributing to maintenance of salivary [Ca(2+)]. CSR could therefore be a potentially important protective mechanism against formation of salivary gland stones (sialolithiasis) and infection (sialoadenitis).


Figures

FIGURE 1.
FIGURE 1.
Localization and function of CSR in salivary duct. A, immunocytochemical localization of CSR in SMG tissue section showing labeling (diaminobenzidine; brown precipitate) with control (rabbit IgG) (i) and anti-CSR antibody (ii) to granular convoluted (GCT) and striated ducts (SD). Yellow arrows in iii (enlargement of middle panel) indicate dense signal at the apical region in striated ducts. B, inset, representative of freshly dispersed SMG cells isolated, showing highly distinguishable ducts and acini. These cells are loaded with fura-2 and used for [Ca2+]i measurement. Ductal cells were selected under the microscope for imaging. B–E, mean fluorescence traces (obtained from 3–4 separate experiments, 30–40 cells) of fura-2-loaded SMG ducts. Gd3+ (200 μm) was added (B) to cells in a Ca2+-free medium. C, application of l-Phe/l-Tryptophan (l-Try) (10 mm) in medium containing 1 mm Ca2+. D and E, activation of CSR and Ca2+ entry by neomycin (500 μm) (D) and l-Phe (5 mm) (E) at different external [Ca2+]. A complete block of CSR by NPS-2143 is shown in cells incubated with l-Phe (E, red traces). E, inset, peak [Ca2+]i significantly decreased (p < 0.01) in response to control (l-Phe) and NPS-2143- (1 μm) treated cells. Changes in external [Ca2+] and other conditions are otherwise indicated in the figure.
FIGURE 2.
FIGURE 2.
Co-localization and interaction of TRPC3 and CSR in salivary gland duct. A, immunofluorescence detection of TRPC3 and AQP5 in SMG tissue using anti-TRPC3 and anti-AQP5 antibodies. Yellow arrows indicate labeling with TRPC3 (left), AQP5 (middle), and overlay (right); blue color shows DAPI-stained nucleus. Scale bar, 20 μm. B, confocal microscopy detection of TRPC3 and CSR in mouse SMG sections using anti-TRPC3 and anti-CSR antibodies. White arrows indicate TRPC3 (left; green), CSR (middle; red), and overlay of TRPC and CSR (right; yellow). Nuclei were stained with DAPI (blue). Scale bar, 20 μm. Using the Volocity software to threshold the signals, almost complete overlap was seen between green and red colors. In an unthresholded image the overlap was approximately 70%. C, Western blots (IB) showing co-immunoprecipitation of TRPC3 (*) and CSR (**) using anti-TRPC3 antibody for immunoprecipitation (IP). Anti-TRPC3 and anti-CSR antibodies were used to detect the two proteins in the IP fraction. Controls of co-IPs are shown using rabbit IgG instead of primary antibody. Input of TRPC3(x) and CSR (xx) are also shown (1/10–1/20 of the IP). D, freshly dispersed SMG primary cells were treated (+) with l-Phe (10 mm) plus 1.2 mm Ca2+, lysed with RIPA buffer, and then immunoprecipitation was performed using anti-CSR antibody. Untreated (−) cells were used as control. Western blotting (IB) using anti-TRPC3 antibody was used for detection of the protein in the IP fraction and lysates (input; 1/10 of IP). E and F, mouse SMG (freshly dispersed) cells were loaded with fura-2 for 30 min. Graphs are representative of mean fluorescence traces (3–4 separate experiments) of fura-2-loaded SMG duct (selected under microscope while imaging). E, OAG (100 μm) activation in cells treated (3 μm Pyr3; TRPC3 inhibitor) or not (control). F, Ca2+ entry in response to CSR activation by l-Phe (control; 20 mm) and block of this function in cells treated with Pyr3 (3 μm). All other additions are indicated in the figure.
FIGURE 3.
FIGURE 3.
Properties of CSR-mediated signaling in SMIE cells. A, mean fluorescence traces (representative of data from 3–4 separate experiments) of fura-2-loaded SMIE cells. Cells were bathed in Ca2+-free medium, and then 1–5 mm Ca2+ was added to the external medium to activate CSR. 1 μm NPS-2143 was added where indicated (red) to block this response. B and C, individual fluorescence traces indicate the changes in response of Fluo-4-loaded SMIE cells. Cells were bathed in 0.5 mm Ca2+-containing medium and then applied to 10 mm l-Phe with 1.2 mm external Ca2+ (B) showing pattern of [Ca2+]i rise in response to both l-Phe and Ca2+. Similarly, application of neomycin (500 μm) in external Ca2+ free medium followed by l-Phe (10 mm) with 0.5 mm Ca2+ (C) resulted Ca2+ entry due to [Ca2+]i rise. D, Gd3+- (200 μm) induced activation of CSR in Fluo-4-loaded SMIE cells. Mean fluorescence traces (representative of 3–4 separate experiments) show an increase of [Ca2+]i in response to Gd3+ and a block of this response by application of PLC inhibitor, U73122 (500 μm). U73342, an inactive analog of U73122, was used as a control. Mean fluorescence traces represent data from 3–4 separate experiments.
FIGURE 4.
FIGURE 4.
Evidence for functional CSR and Ca2+ signaling in SMIE cells. A and B, mean fluorescence traces of Fluo-4-loaded SMIE cells. Cells bathed in 0.5 mm Ca2+ were treated with 10 mm l-Phe or l-Phe (10 mm) plus 1 μm NPS-2143 (A). l-Phe with 0.5 mm external Ca2+ was added to control or shTRPC3-transfected cells (B). Ca2+ (2 mm) addition is shown on the trace. B, inset, Western blots (IB) using anti-TRPC3 antibody, showing knockdown of TRPC3 protein by TRPC3 shRNA (31). β-Actin was used as a loading control for TRPC3 protein. C, mean fluorescence traces of Fura-2-loaded SMIE cells. Cells were transfected with scrambled (control) or siCSR. Both groups of cell were bathed in buffer with 0.5 mm external Ca2+ and then treated with 10 mm l-Phe. C, inset, Western blots using anti-CSR antibody showing knockdown of CSR protein by siRNA to CSR. β-Actin in the lower panel represents as loading control for CSR protein. Additions/removals of Ca2+ in the external medium are indicated in the figure.
FIGURE 5.
FIGURE 5.
Localization of CSR and TRPC3 in polarized SMIE cells. A, bar diagram of TER showing the establishment of polarity while cells were growing onto Transwell filter. Error bars, S.D. B, representative images of confocal X-Z sections of polarized SMIE cells grown in Transwell filter support. Top panel represents the staining with Z01 (green signal), a tight junction marker at the junction of apical and lateral region. The middle panel shows Na+,K+-ATPase (NaK; basolateral marker), indicating lateral localization (green signal); nuclei are stained with DAPI (blue signal). Bottom panel shows apical localization of TRPC3 (green signal), indicating an apical expression of TRPC3; nuclei are stained with propidium iodide (red signal). C, confocal sections (XY and XZ) of polarized SMIE cells (grown onto a Transwell filter) labeled with anti-CSR antibody (rabbit, 1:100 dilution). D, Western blot (IB) using anti-CSR antibody (Rabbit, 1:500 dilution) showing the expression of endogenous CSR protein in SMIE cells and overexpression of CSR in typical HEK cells glycosylated bands (bands did not result in untransfected cells).
FIGURE 6.
FIGURE 6.
Domain-specific function of CSR in SMIE cells. A, representative images (Confocal on live cells; X-Z sections) of Fluo-4-loaded polarized SMIE cells on Transwell filter. Average intensity data of the demarked (equal) region of interest (dashed boxes) in the apical (white) and basal (yellow) were plotted showing changes in Fluo-4 ([Ca2+]i) signal. Graphical presentation of (mean fluorescence traces) of Fluo-4-loaded SMIE cells represents [Ca2+]i rise within the apical/basal region. All applications were made apically. B, addition of l-Phe (10 mm) and 0.5 mm external Ca2+. C, [Ca2+]i rise due to application of 1.2 mm external Ca2+. Inset, bar diagram showing the rate of increase in apical [Ca2+]i signal (p < 0.01) than basal signal in response to [Ca2+]o, indicating the induction of Ca2+ mobilization from apical to basal region. D, effect of l-Phe in the presence of CSR antagonist (NPS-2143; 1 μm) and thapsigargin (Tg; 1 μm). E, simultaneous changes in Fluo-4 fluorescence in apical and basal regions of the cells following application of thapsigargin (1 μm).
FIGURE 7.
FIGURE 7.
Activation of CSR in SMIE cells enhanced CSR-TRPC3 complex formation and plasma membrane expression of TRPC3. A, SMIE cells grown in Transwell filter treated with l-Phe and/or NPS-2143 were solubilized using RIPA buffer, and co-immunoprecipitation (IP) experiment was performed using anti-CSR antibody (1:100). i, Western blot using anti-TRPC3 antibody (1:500) shows changes in TRPC3 bands representing the increase in complex formation induced by the treatment with l-Phe. ii, complex formation is inhibited after SMIE cells are treated with l-Phe (10 mm) and/or NPS-2143 (1 μm). B, cell surface biotinylation experiment in SMIE cells was performed to determine plasma membrane expression of TRPC3 in response to CSR activation. SMIE cells grown in Transwell filter were treated with l-Phe (10 mm) and/or NPS-2143 (1 μm) then biotinylated using EZ-Link Sulfo-NHSSS-Biotin and solubilized using RIPA buffer. Co-IP experiments were performed using NeutrAvidin beads followed by Western blotting using anti-TRPC3 (1:500) and Na+,K+-ATPase (NaK; 1:1000) antibodies showing changes in TRPC3 bands representing an increase in surface expression induced by l-Phe (i). More importantly, treatment with l-Phe and/or NPS-2143 inhibited the complex formation (ii). Another plasma membrane protein did not change, indicating the specificity of the biotinylation experiment (lower panel).
FIGURE 8.
FIGURE 8.
Proposed mechanism of CSR signaling in salivary duct. Diagram shows the proposed mechanism of CSR-regulated signaling in salivary ductal cells. The alteration in [Ca2+] in ductal lumen activates CSR, which in turn trigger TRPC3 activation though a PLC-dependent mechanism and causes Ca2+ entry into the ductal cell. This process could potentially initiate a transductal flow of Ca2+ from apical to basal end. Furthermore, Ca2+-sensing properties of CSR by [Ca2+]o could potentially be modulated by the presence of endogenous (saliva) CSR modulator(s).

References

    1. Hoenderop J. G., Nilius B., Bindels R. J. (2005) Calcium absorption across epithelia. Physiol. Rev. 85, 373–422 - PubMed
    1. Knauf H., Lubcke R., Kreutz W., Sachs G. (1982) Interrelationships of ion transport in rat submaxillary duct epithelium. Am. J. Physiol. 242, F132–139 - PubMed
    1. Zentner M. D., Lin H. H., Wen X., Kim K. J., Ann D. K. (1998) The amiloride-sensitive epithelial sodium channel α-subunit is transcriptionally down-regulated in rat parotid cells by the extracellular signal-regulated protein kinase pathway. J. Biol. Chem. 273, 30770–30776 - PubMed
    1. Dinudom A., Harvey K. F., Komwatana P., Young J. A., Kumar S., Cook D. I. (1998) Nedd4 mediates control of an epithelial Na+ channel in salivary duct cells by cytosolic Na+. Proc. Natl. Acad. Sci. U.S.A. 95, 7169–7173 - PMC - PubMed
    1. Homann V., Kinne-Saffran E., Arnold W. H., Gaengler P., Kinne R. K. (2006) Calcium transport in human salivary glands: a proposed model of calcium secretion into saliva. Histochem. Cell Biol. 125, 583–591 - PubMed

Publication types

LinkOut - more resources