. 2012 Jul 31;109(31):12662-7.
doi: 10.1073/pnas.1209965109. Epub 2012 Jul 9.

Circadian clock protein cryptochrome regulates the expression of proinflammatory cytokines

Affiliations

Circadian clock protein cryptochrome regulates the expression of proinflammatory cytokines

Rajesh Narasimamurthy et al. Proc Natl Acad Sci U S A. .

Abstract

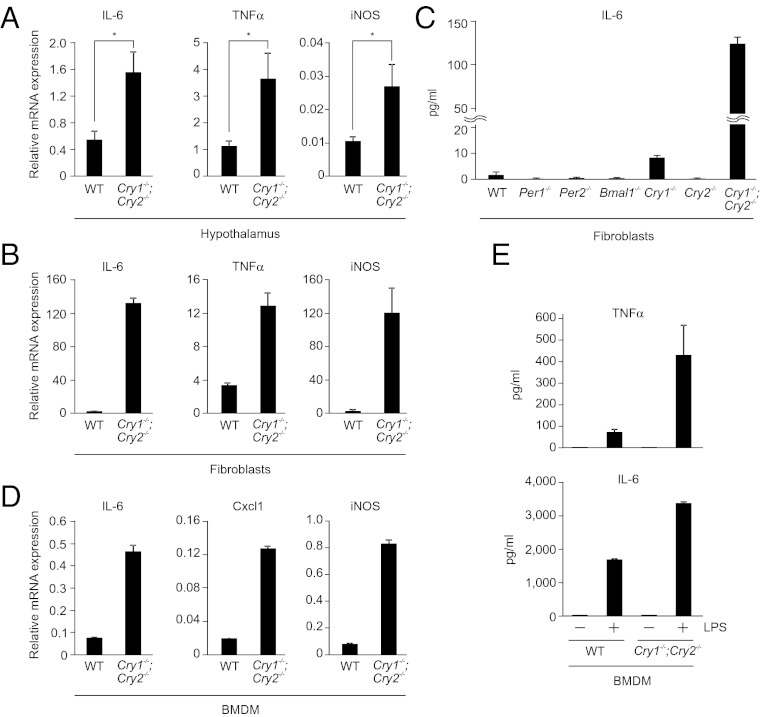
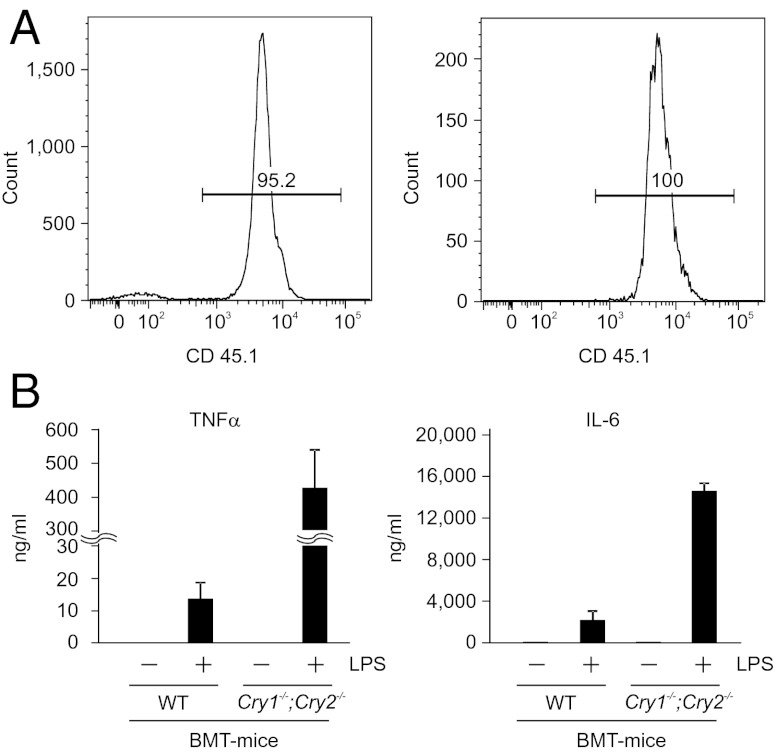
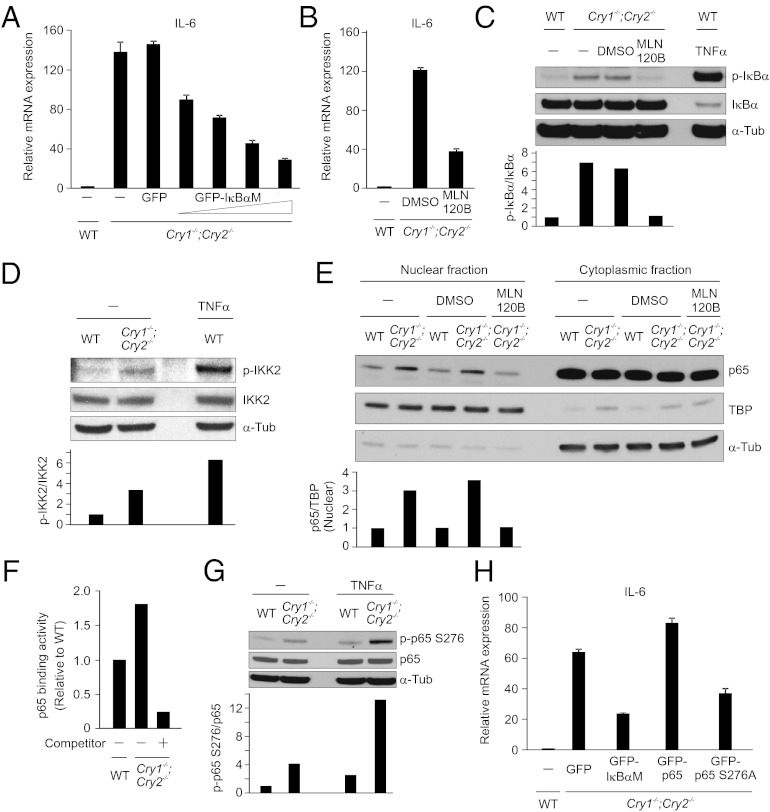
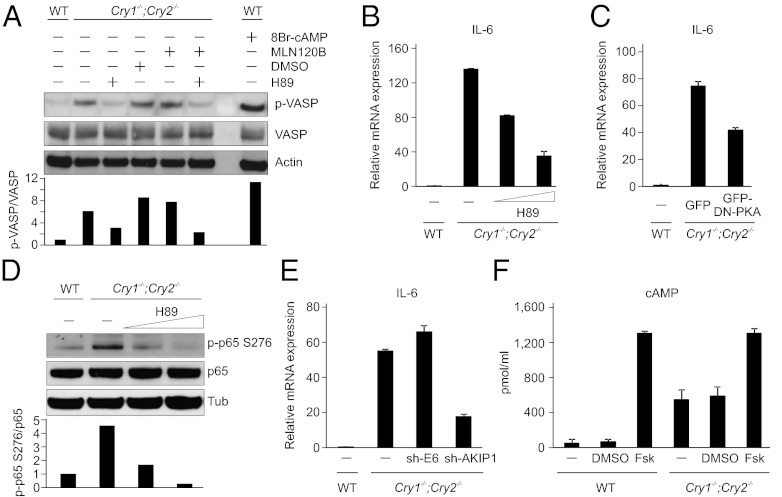
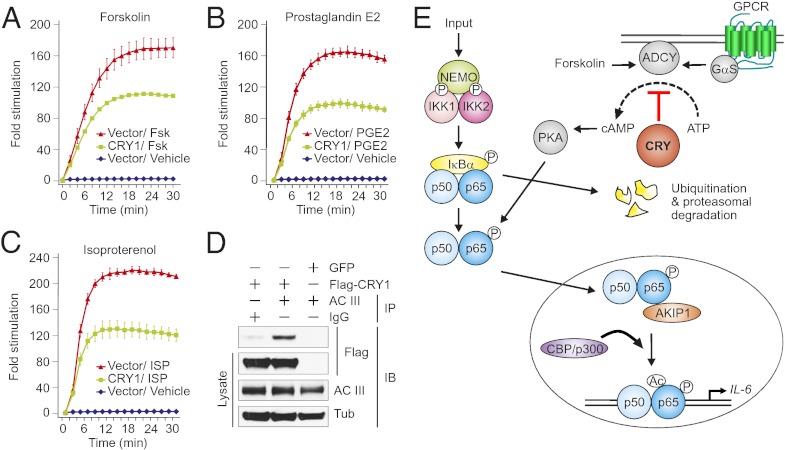
Chronic sleep deprivation perturbs the circadian clock and increases susceptibility to diseases such as diabetes, obesity, and cancer. Increased inflammation is one of the common underlying mechanisms of these diseases, thus raising a hypothesis that circadian-oscillator components may regulate immune response. Here we show that absence of the core clock component protein cryptochrome (CRY) leads to constitutive elevation of proinflammatory cytokines in a cell-autonomous manner. We observed a constitutive NF-κB and protein kinase A (PKA) signaling activation in Cry1(-/-);Cry2(-/-) cells. We further demonstrate that increased phosphorylation of p65 at S276 residue in Cry1(-/-);Cry2(-/-) cells is due to increased PKA signaling activity, likely induced by a significantly high basal level of cAMP, which we detected in these cells. In addition, we report that CRY1 binds to adenylyl cyclase and limits cAMP production. Based on these data, we propose that absence of CRY protein(s) might release its (their) inhibition on cAMP production, resulting in elevated cAMP and increased PKA activation, subsequently leading to NF-κB activation through phosphorylation of p65 at S276. These results offer a mechanistic framework for understanding the link between circadian rhythm disruption and increased susceptibility to chronic inflammatory diseases.


Conflict of interest statement

The authors declare no conflict of interest.

Figures

Fig. 1.
Fig. 1.
Lack of a functional circadian clock system by absence of the circadian oscillator component CRY constitutively upregulates expression of inflammatory cytokines. (A) Estimation of mRNA levels of indicated genes by quantitative real-time PCR (qRT–PCR) in the hypothalamus region of brain of WT and Cry1−/−;Cry2−/− mice are shown. Data are mean ± SEM (n = 4 mice per group); *P < 0.05. (B) Quantification of mRNA levels of indicated genes by qRT–PCR in WT and Cry1−/−;Cry2−/− fibroblasts are shown. Data are mean ± SD (n = 3). (C) WT, Per1−/−, Per2−/−, Bmal1−/−, Cry1−/−, Cry2−/−, and Cry1−/−;Cry2−/− fibroblasts were left untreated for 12 h and the supernatants were analyzed for IL-6 protein levels by ELISA. Data are mean ± SD (n = 3). (D) BMDM from WT and Cry1−/−;Cry2−/− mice were analyzed for mRNA levels of indicated genes by qRT–PCR. Data are mean ± SD (n = 3). (E) WT and Cry1−/−;Cry2−/− BMDM cells were either untreated or treated with LPS (1 μg/mL for TNF-α and 10 ng/mL for IL-6 analysis) for 12 h and the supernatants were estimated for TNF-α or IL-6 protein levels by ELISA are shown. Data are mean ± SD (n = 4). Relative mRNA expression levels after normalization to actin are shown in A, B, and D.
Fig. 2.
Fig. 2.
Absence of cryptochrome potentiate immune system of the mice to secrete increased levels of inflammatory cytokines upon LPS challenge. (A) Reconstitution analysis by FACS of blood lymphocytes derived from recipient mice, B6.129S4-Il2rgtm1Wjl/J (CD45.2 positive), 8 wk after injection with bone marrow of donor mice (CD45.1 positive) of one representative animal. Left shows typical donor contribution to total lymphocytes. Right shows the percentage of CD45.1 positive cells (donor) gated on CD11b positive cells. (B) WT or Cry1−/−;Cry2−/− BMT were injected with either PBS or LPS (5 mg/kg) and the 2-h serum samples collected from these mice were analyzed for TNF-α and IL-6 protein levels by ELISA. Data are mean ± SEM (n = 3 mice per group for LPS injection and n = 1 for PBS injection).
Fig. 3.
Fig. 3.
Blocking the canonical NF–κB pathway suppresses constitutive activation of IL-6 in Cry1−/−;Cry2−/− fibroblasts. (A) Estimation of IL-6 mRNA by qRT–PCR of Cry1−/−;Cry2−/− fibroblasts infected with lentivirus expressing GFP- or GFP-tagged superrepressor mutant of IκBα (GFP-IκBαM) with increasing dose are shown. (B) IL-6 mRNA expression was quantified by qRT–PCR of Cry1−/−;Cry2−/− fibroblasts treated with either DMSO or MLN120B (10 μM) for 2 h. (C) Total cell lysates of WT and Cry1−/−;Cry2−/− fibroblasts either untreated or treated with DMSO or with the IKK2 inhibitor, MLN 120B (10 μM, 1 h) were analyzed by Western blot for phospho-IκBα, IκBα, and tubulin. (D) Total cell lysates of WT and Cry1−/−;Cry2−/− fibroblasts analyzed by Western blot for phospho-IKK2, IKK2, and tubulin are shown. (E) Nuclear and cytoplasmic fractions of untreated or DMSO-treated WT and untreated or DMSO- or MLN120B-treated Cry1−/−;Cry2−/− fibroblasts analyzed by Western blot for p65, TATA-binding protein (TBP) and tubulin are shown. Detection of TBP and tubulin are used as markers of nuclear and cytoplasmic fractions, respectively. (F) Nuclear extracts (5 μg) from WT and Cry1−/−;Cry2−/− fibroblasts analyzed for p65 binding activity by ELISA are shown. Competition assay was performed with wild-type NF–κB consensus oligonucleotides. Values shown are relative to WT, value of WT p65 binding activity is set to 1, which is a representative of three independent experiments. (G) Western blot show the level phospho-p65 S276 in total cell lysates of WT and Cry1−/−;Cry2−/− fibroblasts either untreated or treated with TNF-α (10 ng/mL, 30 min). (H) Estimation of IL-6 mRNA levels by qRT–PCR of Cry1−/−;Cry2−/− fibroblasts expressing either GFP or superrepressor form of IκBα (GFP-IκBαM) or GFP-p65 or mutant form of p65 (GFP-p65 S276A) are shown. Relative mRNA expression levels after normalization to actin are shown in A, B, and H, and data are mean ± SD (n = 3).
Fig. 4.
Fig. 4.
Increased cAMP and PKA signaling activity and also the PKA-mediated phosphorylation of p65 at S276 contributes to elevated NF–κB target gene activation in Cry1−/−;Cry2−/−. (A) WT fibroblasts were either untreated or treated with 8Br–cAMP (100 μM) for 30 min and Cry1−/−;Cry2−/− fibroblasts were either untreated or treated with H89 (20 μM), DMSO, or MLN120B (10 μM) for 1 h, and total cell lysates were analyzed by Western blot for phospho-VASP, VASP and actin. (B) Quantification of IL-6 mRNA expression by qRT–PCR of Cry1−/−;Cry2−/− fibroblasts treated with H89 (10 and 20 μM for 1 h). (C) Estimation of IL-6 mRNA expression by qRT–PCR of Cry1−/−;Cry2−/− fibroblasts expressed with a dominant–negative (GFP–DN–PKA) form of PKA. (D) Total cell lysates of untreated WT and untreated or H89 (20 and 30 μM, 1 h) treated Cry1−/−;Cry2−/− fibroblasts were analyzed by Western blot for phospho-p65 S276, p65 and tubulin. (E) RNA extracted from Cry1−/−;Cry2−/− fibroblasts infected with lentivirus expressing sh-RNA against a nonspecific target gene E6 as a control or against AKIP1 were analyzed for IL-6 mRNA expression by qRT–PCR. (F) Cellular concentration of cAMP measured by ELISA in the lysates of WT and Cry1−/−;Cry2−/− fibroblasts either untreated or treated with DMSO or forskolin (10 μM, 30 min) are shown. Data are mean ± SD (n = 4). Relative mRNA expression levels after normalization to actin are shown in B, C, and E, and data are mean ± SD (n = 3).
Fig. 5.
Fig. 5.
CRY1 inhibits the forskolin-, PGE2-, and isoproterenol-induced generation of intracellular cAMP, likely by binding to and inhibiting the function of adenylyl cyclase. (A–C) Luciferase assay performed to measure the kinetics of cAMP production after stimulation in the presence of 500 μM of IBMX in 293T cells are shown. Fold stimulation of cAMP production are shown after stimulation with either forskolin, PGE2, or isoproterenol (each 10 μM) in the absence (control vector) or presence of CRY1 expression. Data are mean ± SD (n = 3). (D) CRY1 interacts with adenylyl cyclase. All of the indicated immunoprecipitate and lysate samples analyzed by Western blot for Flag tag (CRY1), adenylyl cyclase III and tubulin are shown. (E) The proposed model showing the likely function of CRY in binding to and suppressing the action of adenylyl cyclase in cAMP production and the pathways activated in the absence of CRY proteins.

References

    1. Bass J, Takahashi JS. Circadian integration of metabolism and energetics. Science. 2010;330:1349–1354. - PMC - PubMed
    1. Liu AC, Lewis WG, Kay SA. Mammalian circadian signaling networks and therapeutic targets. Nat Chem Biol. 2007;3:630–639. - PubMed
    1. Cho H, et al. Regulation of circadian behaviour and metabolism by REV-ERB-α and REV-ERB-β. Nature. 2012;485:123–127. - PMC - PubMed
    1. Saini C, Suter DM, Liani A, Gos P, Schibler U. The mammalian circadian timing system: Synchronization of peripheral clocks. Cold Spring Harb Symp Quant Biol. 2011;76:39–47. - PubMed
    1. Imeri L, Opp MR. How (and why) the immune system makes us sleep. Nat Rev Neurosci. 2009;10:199–210. - PMC - PubMed

Publication types

MeSH terms