. 2012 Aug 14;109(33):E2205-14.
doi: 10.1073/pnas.1201911109. Epub 2012 Jul 9.

Up-regulation of the mitotic checkpoint component Mad1 causes chromosomal instability and resistance to microtubule poisons

Affiliations

Up-regulation of the mitotic checkpoint component Mad1 causes chromosomal instability and resistance to microtubule poisons

Sean D Ryan et al. Proc Natl Acad Sci U S A. .

Abstract

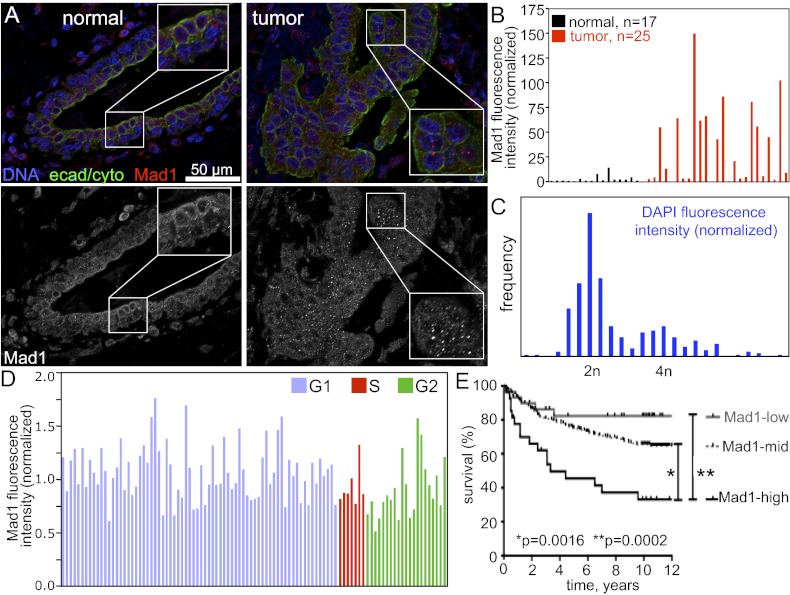
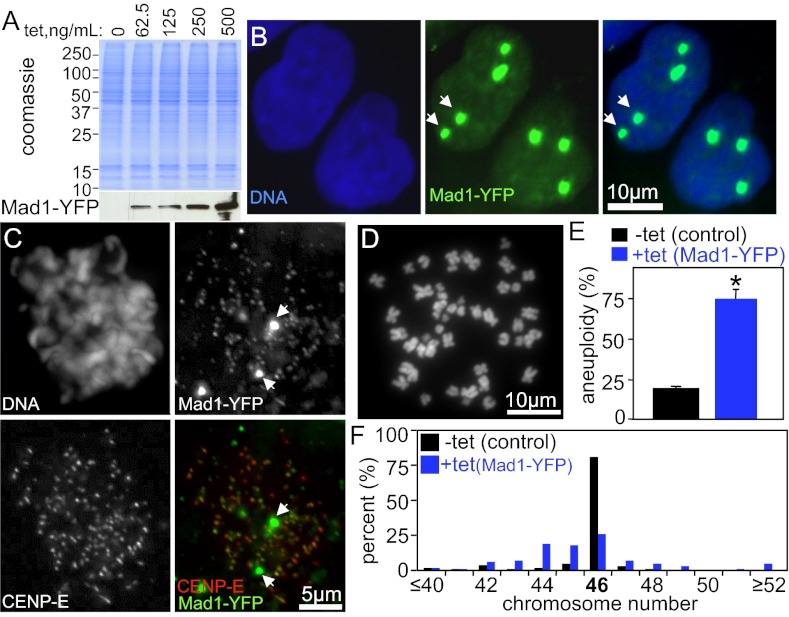
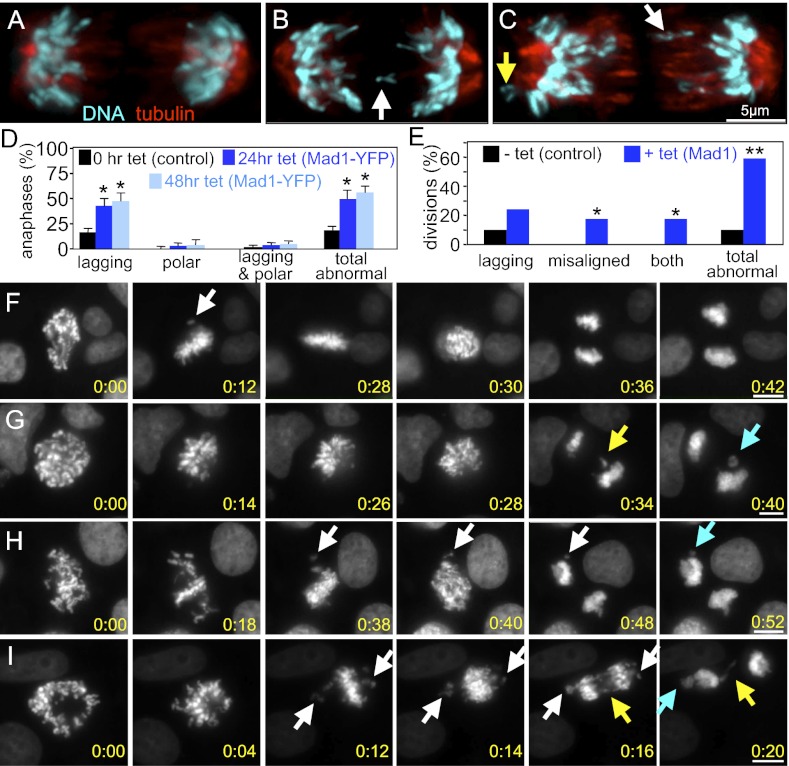
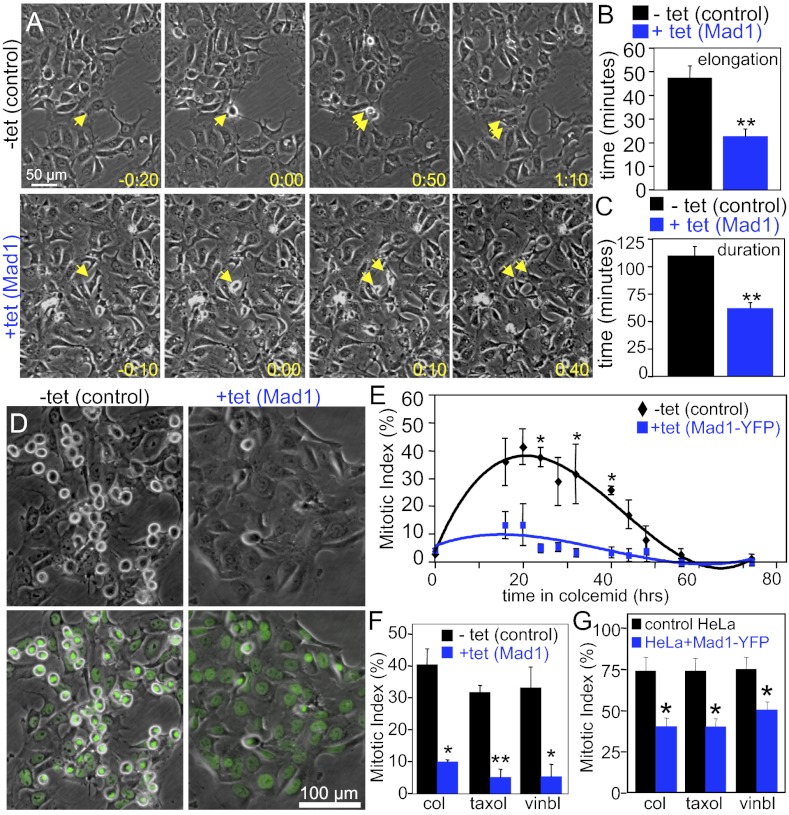
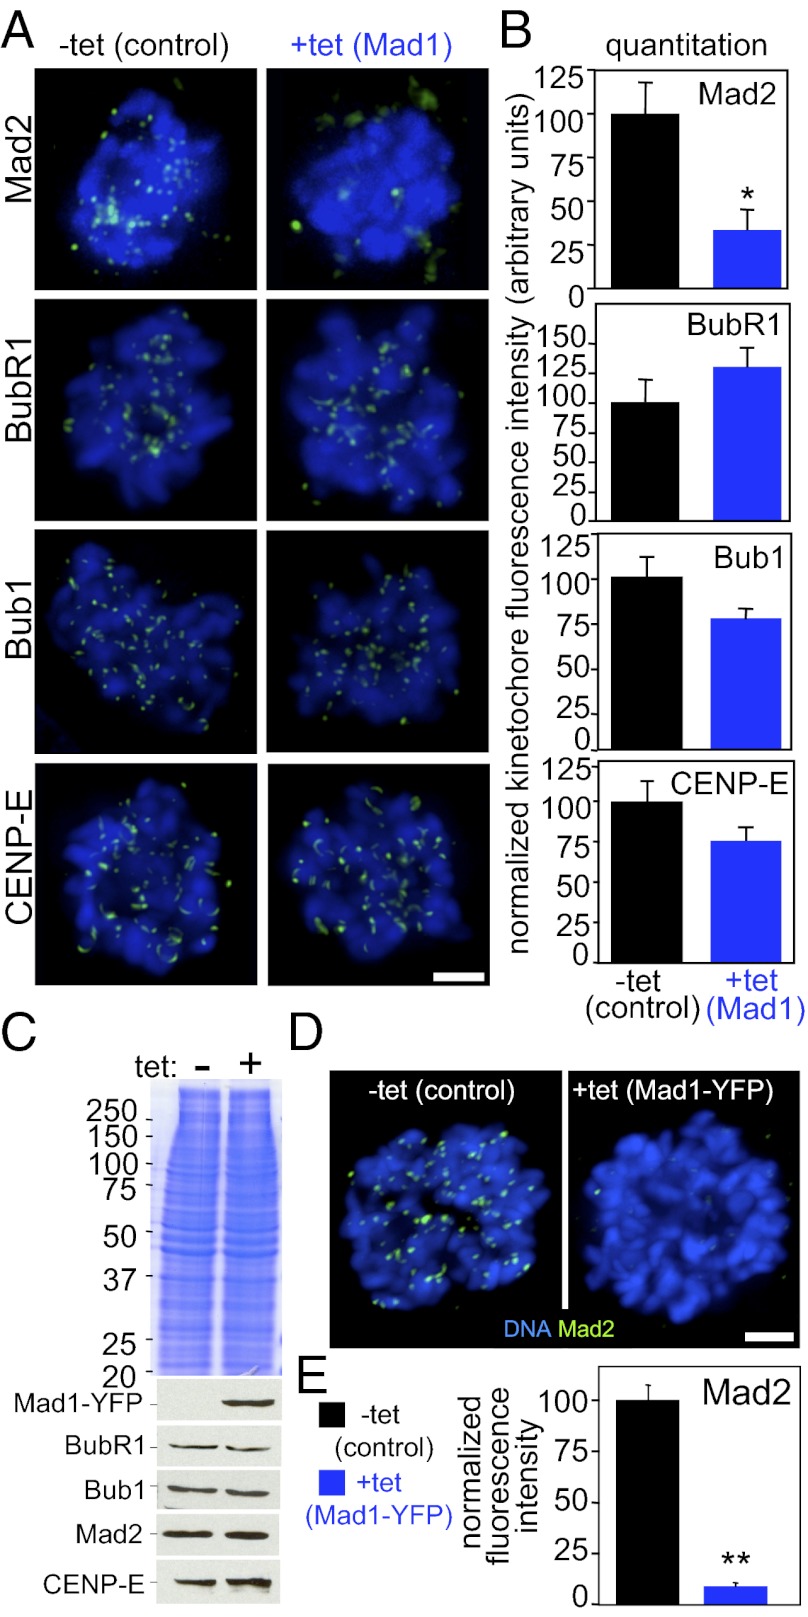
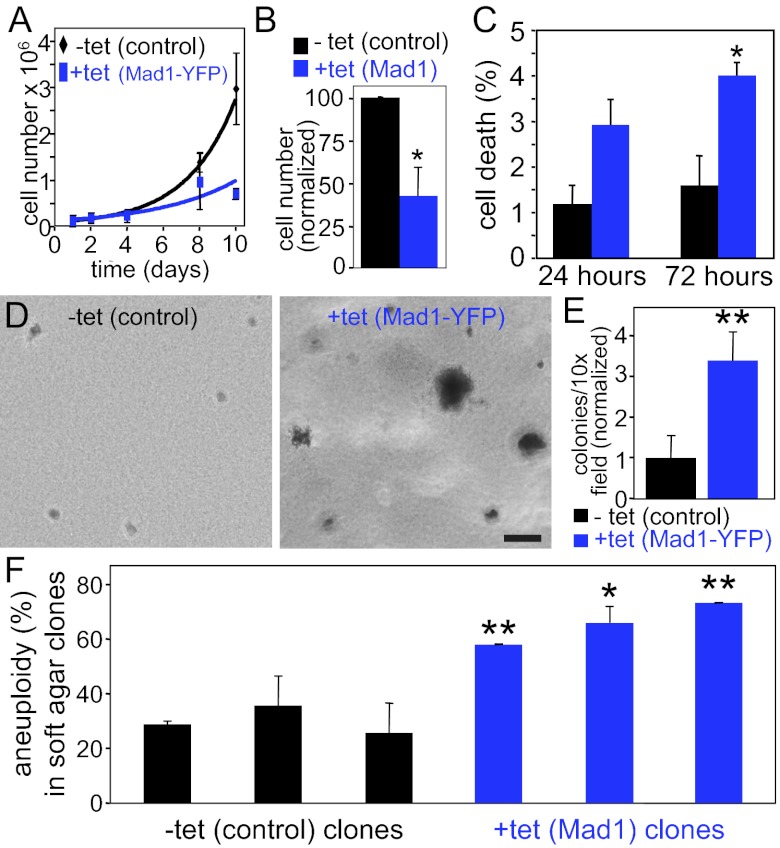
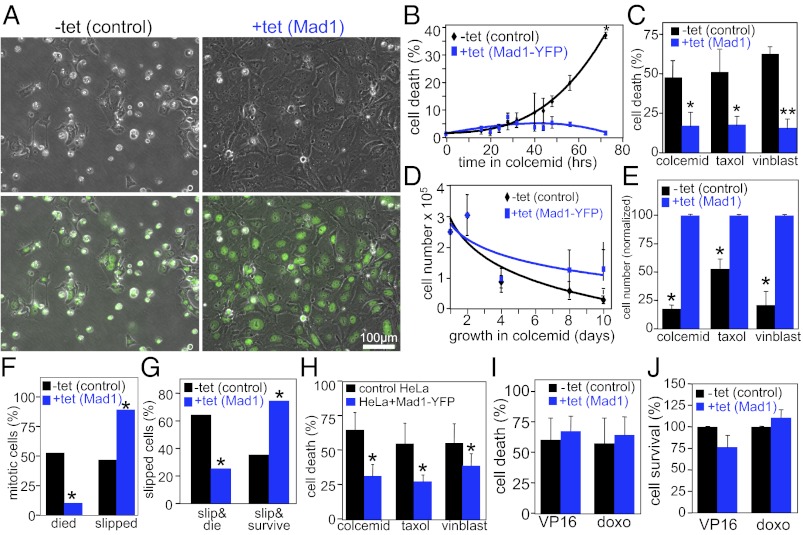
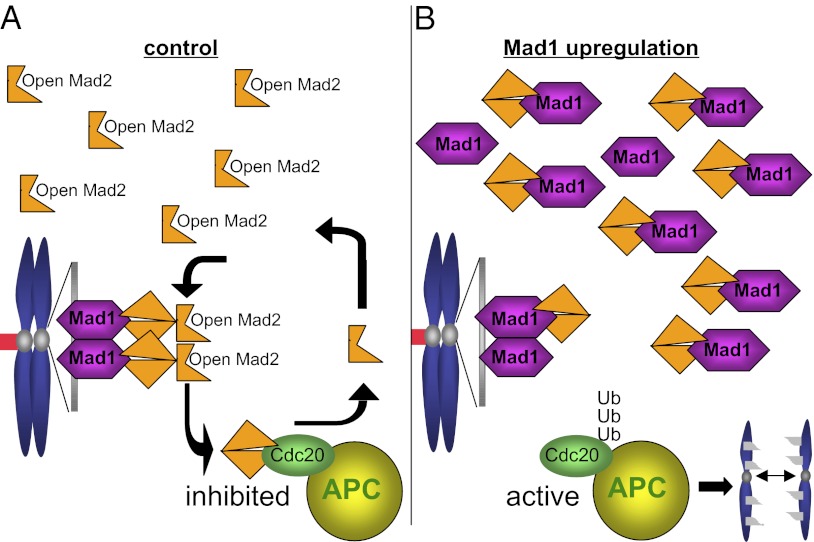
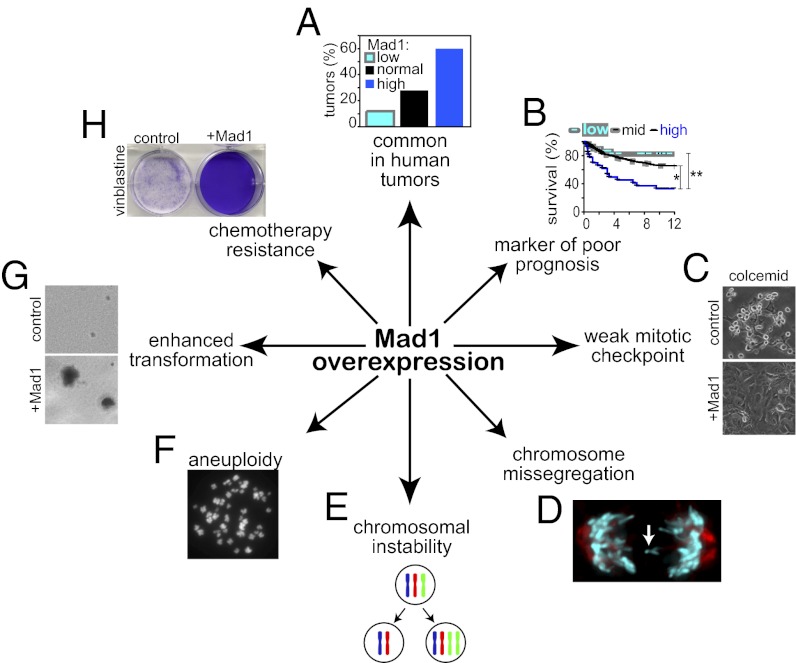
The mitotic checkpoint is the major cell cycle checkpoint acting during mitosis to prevent aneuploidy and chromosomal instability, which are hallmarks of tumor cells. Reduced expression of the mitotic checkpoint component Mad1 causes aneuploidy and promotes tumors in mice [Iwanaga Y, et al. (2007) Cancer Res 67:160-166]. However, the prevalence and consequences of Mad1 overexpression are currently unclear. Here we show that Mad1 is frequently overexpressed in human cancers and that Mad1 up-regulation is a marker of poor prognosis. Overexpression of Mad1 causes aneuploidy and chromosomal instability through weakening mitotic checkpoint signaling caused by mislocalization of the Mad1 binding partner Mad2. Cells overexpressing Mad1 are resistant to microtubule poisons, including currently used chemotherapeutic agents. These results suggest that levels of Mad1 must be tightly regulated to prevent aneuploidy and transformation and that Mad1 up-regulation may promote tumors and cause resistance to current therapies.


Conflict of interest statement

The authors declare no conflict of interest.

Figures

Fig. 1.
Fig. 1.
Overexpression of Mad1 is common in tumors and is a marker of poor prognosis. (A) Images of normal breast tissue (Left) and breast tumor tissue (Right) stained for DNA (blue), a mixture of e-cadherin and cytokeratin to identify epithelial cells (green) and Mad1 (red). Black and white images of Mad1 are shown in the bottom row. Inset: Enlargement of boxed region shows Mad1 puncta previously identified as annulate lamellae (34). (Scale bar, 50 μm.) (B) Quantification of Mad1 fluorescence intensity pictured in A. Mad1 fluorescence intensity in 16 normal breast samples, a normal spleen sample, and 25 breast tumor samples was quantified in a region of interest containing the nucleus and perinuclear region to ensure inclusion of nuclear envelope staining. Values shown are normalized to the median value in normal tissues (Materials and Methods). (C) Histogram of DAPI fluorescence intensity in DLD1 control cells. (D) Mad1 quantification in control DLD1 cells shows that Mad1 levels do not vary more than twofold from the average value during the cell cycle. Cell cycle stages were identified based on DAPI fluorescence intensity shown in C. (E) Kaplan–Meier survival curves of patients with breast cancer expressing high (black), intermediate (mid; gray dashed), or low (gray) levels of Mad1. Significance was calculated by using a Wilcoxon log-rank test (SI Appendix, Table S1).
Fig. 2.
Fig. 2.
Up-regulation of Mad1 causes aneuploidy. (A) Tet-inducible expression of Mad1-YFP. Coomassie staining was used as a loading control. (B) Mad1-YFP (green) localizes to nuclei in interphase, like endogenous Mad1. Arrows indicate that Mad1-YFP also localizes to additional sites previously identified as annulate lamellae (34). (C) Mad1-YFP (green) localizes to kinetochores (marked with CENP-E, red) during mitosis, as well as to additional sites (arrows). (D) Chromosome spread of DLD1 cell. (E) DLD1 cells expressing Mad1-YFP for 48 h have higher levels of aneuploidy than control cells (n = 100 cells from two independent experiments; *P < 0.05, t test). (F) Chromosome numbers in control and Mad1-YFP–expressing cells show near-diploid aneuploidy with minimal tetraploidy (n = 100 cells from two independent experiments; SI Appendix, Fig. S2 AC, shows results with untagged Mad1).
Fig. 3.
Fig. 3.
Elevated expression of Mad1 causes CIN from lagging and misaligned chromosomes. Control (A) and Mad1-YFP–expressing (B and C) DLD1 cells in anaphase. White arrows indicate lagging chromosomes. Yellow arrow indicates polar chromosome. (D) Fixed cells expressing Mad1-YFP have high levels of lagging chromosomes in anaphase (n > 100 cells from each of four independent experiments; *P < 0.05, t test). SI Appendix, Fig. S2 D and E, shows results with untagged Mad1. (E) Quantification of segregation errors observed during time-lapse microscopy of DLD1 cells stably expressing histone H2B-RFP, as shown in FI (*P < 0.05, t test). (FI) Still images from time-lapse acquisition of H2B-RFP in control (F) and Mad1-overexpressing (GI) cells (Movies S1, S2, S3, and S4). Panel 1, First image after nuclear envelope breakdown. Panel 3, Image immediately before anaphase onset, shown in panel 4. Control cells waited for the last chromosome to align (F, panel 2, arrow) before segregating chromosomes in anaphase. (GI) Cells induced to overexpress Mad1 for 24 h show lagging chromosomes (yellow arrows) and/or misaligned chromosomes at anaphase onset (white arrows). Some of the lagging and misaligned chromosomes form micronuclei (turquoise arrows). (Scale bars, 10 μm.) The time from nuclear envelope breakdown is shown in hours:minutes in the bottom right corner of each image.
Fig. 4.
Fig. 4.
Excess Mad1 causes a weakened mitotic checkpoint. (A) Stills from 10× phase-contrast movies show control cells (Upper) and cells overexpressing Mad1 (Lower) in interphase (Left), as they round up in mitosis (Center Left), elongate (Center Right), and readhere at the end of mitosis (Right). Numbers show time in hours:minutes that corresponds with the division of the cells denoted by arrows. 0:00 is the time at which the cells round up in mitosis (Movies S5 and S6). (Scale bar, 50 μm.) (B) The time from cell rounding to cell elongation (which roughly corresponds to anaphase onset) is shortened in cells expressing increased levels of Mad1. (C) The duration of mitosis, as measured from cell rounding to cell flattening, is decreased in cells with excess Mad1 (B and C, n > 70; **P < 0.001, t test). (D) Phase-contrast (Upper) or phase-contrast and Hoechst (Lower) images of control and Mad1-overexpressing cells treated with colcemid for 20 h. Note that the frequency of rounded, mitotic cells is significantly lower in cells overexpressing Mad1. (E) Mad1-YFP–expressing cells do not accumulate in mitosis like control cells in response to colcemid (n > 500 cells from each of two independent experiments; *P < 0.05, t test). (F) Reduced mitotic index in Mad1-overexpressing cells treated with the microtubule poisons colcemid (col), paclitaxel (Taxol), or vinblastine (vinbl) for 20 h (n > 250 cells from each of three independent experiments; *P < 0.05 and **P < 0.001, t test). (G) Mad1-YFP expression also causes deficits in mitotic checkpoint signaling in HeLa cells treated with colcemid (col), paclitaxel (Taxol), or vinblastine (vinbl) for 24 h (n > 500 cells from each of four independent experiments; *P < 0.05).
Fig. 5.
Fig. 5.
Mad2 is mislocalized from kinetochores in cells expressing excess Mad1. (A) Quantitative immunofluorescence of Mad2, BubR1, Bub1, CENP-E (green), and DNA (blue) in cells treated with colcemid for 1 h. (Scale bar, 2.5 μm.) (B) Quantification of kinetochore fluorescence intensity (n = 37–119 cells from at least three independent experiments; *P < 0.05, t test). SI Appendix, Fig. S3B, shows quantification of an independent clone of Mad1-overexpressing cells. (C) Mad1-YFP expression does not affect expression levels of other mitotic checkpoint components including BubR1, Bub1, Mad2, and CENP-E. Coomassie stain was used as a loading control. (D) Mad2 localizes to kinetochores during mitosis in control cells, but is largely mislocalized in cells expressing Mad1-YFP. (Scale bar, 5 μm.) (E) Quantification of Mad2 kinetochore fluorescence in Mad1-YFP–expressing cells (n > 32 cells from three independent experiments; **P < 0.001, t test).
Fig. 6.
Fig. 6.
Up-regulation of Mad1 enhances transformation. (A) Expression of Mad1-YFP inhibits cell growth (n = 2). (B) Overexpression of untagged Mad1 for 10 d causes a proliferative defect (n = 3; *P < 0.05, t test). (C) Cells overexpressing Mad1 have a higher incidence of cell death. Cell death was scored in live cells stained with Hoechst based on cellular and DNA morphology (n ≥ 230 cells from each of three independent experiments; *P < 0.05, t test). (D and E) Cells expressing Mad1-YFP are more likely to exhibit anchorage independent growth in soft agar, a characteristic of transformation. (D) Images of cells and colonies in soft agar. (Scale bar, 100 μm.) (E) Quantification of colony growth after 10 to 12 d in soft agar (n = 3; **P < 0.001, t test). (F) Mad1-overexpressing anchorage-independent colonies exhibit increased aneuploidy. Three independent clones of control DLD1 cells and cells overexpressing untagged Mad1 were cored from soft agar and scored for aneuploidy using chromosome spreads (n > 50 cells from each clone; *P < 0.05 and **P < 0.001, t test).
Fig. 7.
Fig. 7.
Resistance to microtubule poisons from up-regulation of Mad1. (A) Phase-contrast images alone (Upper) or overlaid with Hoechst images (Lower) of control and Mad1-YFP–expressing cells treated with colcemid for 72 h. (B) Cell death, as scored in A, in control and Mad1-YFP–expressing cells exposed to colcemid for up to 72 h (n > 500 cells from each of two independent experiments; *P < 0.05, t test). (C) Cell death, as scored in A, of control and Mad1-overexpressing cells treated with colcemid, paclitaxel (Taxol), or vinblastine (vinblast) for 72 h (n > 250 cells from at least three independent experiments; *P < 0.05 and **P < 0.001, t test). (D) Cell numbers, as scored by hemacytometer, of control and Mad1-YFP–expressing cells exposed to colcemid (n = 2). (E) Cell numbers of control and Mad1-overexpressing cells exposed to microtubule poisons colcemid, paclitaxel (Taxol), or vinblastine (vinblast) for 10 d (n ≥ 3; *P < 0.05, t test). Cell number is normalized to the number of Mad1-overexpressing cells after drug treatment. (F) Cells expressing elevated levels of Mad1 exhibit less death from mitosis and more slippage than controls when treated with paclitaxel. (G) Control DLD1 cells that slip out of mitosis in paclitaxel are more likely to die than survive, whereas Mad1-overexpressing cells are more likely to survive than to die. (F and G, n = 66 cells from two independent experiments; *P < 0.001, χ2 test). (H) Expression of Mad1-YFP in HeLa cells results in resistance to 48 h treatment with colcemid, paclitaxel (Taxol), and vinblastine (vinblast; n > 500 cells from each of four independent experiments; *P < 0.001, χ2 test). (I and J) Mad1 overexpression does not affect sensitivity to DNA damaging drugs. (I) Cell death was determined as in A after 72 h of treatment with the topoisomerase II inhibitors etoposide (VP16; 15 μM) or doxorubicin [doxo; 500 ng/mL; n > 350 cells from each of four independent experiments; P = 0.6830 (etoposide) and P = 0.5233 (doxorubicin)]. (J) Cell survival was determined after 10 d of treatment with etoposide (VP16; 5 μM) or doxorubicin (doxo; 100 ng/mL) by hemacytometer (n = 3).
Fig. 8.
Fig. 8.
Up-regulation of Mad1 weakens mitotic checkpoint signaling by titrating Mad2. (A) In control cells, Mad2 exists in molar excess over Mad1 (32, 38, 62), permitting a large soluble pool of Mad2, which exists in an open conformation. Open Mad2 from the soluble pool rapidly cycles on and off Mad1–Mad2 heterodimers at unattached kinetochores, which contain Mad2 in a closed conformation. Mad2 that cycles off of unattached kinetochores then inhibits the APC in the context of its specificity factor Cdc20, and delays mitotic progression until all chromosomes are properly attached. (B) When Mad1 is expressed at levels equal to or greater than Mad2, Mad1-binding sites on kinetochores are saturated, and Mad1 localizes to additional, non-kinetochore sites. Mad2 binds to kinetochore- and non–kinetochore-bound Mad1 in the closed conformation, severely depleting the soluble pool of open Mad2. Without the soluble pool of Mad2 to be converted into APC-Cdc20 inhibitors at unattached kinetochores, APC-Cdc20 becomes active, resulting in premature anaphase onset and chromosome missegregation.
Fig. P1.
Fig. P1.
Up-regulation of the mitotic checkpoint component Mad1 causes aneuploidy and promotes tumors. (A and B) Mad1 overexpression is clinically relevant. (A) Mad1 up-regulation is common in human tumors. (B) Patients who show high levels of Mad1 expression experience reduced 12-y survival relative to those with tumors expressing low levels of Mad1. (C) Mad1 overexpressing cells fail to round up and accumulate in mitosis in response to microtubule poisons such as colcemid, which is a characteristic of a weakened mitotic checkpoint response. (DF) The weakened mitotic checkpoint in cells with elevated levels of Mad1 leads to (D) chromosome missegregation, (E) chromosomal instability, and (F) aneuploidy. Arrow in D indicates a chromosome lagging behind the segregating masses of DNA, indicative of chromosome missegregation. (G) Consistent with the hypothesis that aneuploidy drives tumorigenesis, Mad1 up-regulation enhances anchorage-independent growth in soft agar. (H) Crystal violet stain of cells after treatment with the microtubule poison vinblastine, showing that Mad1 overexpression causes resistance to microtubule poisons. It doesn't cause resistance to DNA-damaging drugs, suggesting that chemotherapy regimens for individual patients could be tailored based on the expression of Mad1.

References

    1. Weaver BA, Cleveland DW. Does aneuploidy cause cancer? Curr Opin Cell Biol. 2006;18:658–667. - PubMed
    1. Musacchio A, Salmon ED. The spindle-assembly checkpoint in space and time. Nat Rev Mol Cell Biol. 2007;8:379–393. - PubMed
    1. Rieder CL. Mitosis in vertebrates: The G2/M and M/A transitions and their associated checkpoints. Chromosome Res. 2011;19:291–306. - PubMed
    1. Li X, Nicklas RB. Mitotic forces control a cell-cycle checkpoint. Nature. 1995;373:630–632. - PubMed
    1. Rieder CL, Cole RW, Khodjakov A, Sluder G. The checkpoint delaying anaphase in response to chromosome monoorientation is mediated by an inhibitory signal produced by unattached kinetochores. J Cell Biol. 1995;130:941–948. - PMC - PubMed

Publication types

MeSH terms

LinkOut - more resources