Review
. 2012 Jul-Aug;13(4):371-90.
doi: 10.3348/kjr.2012.13.4.371. Epub 2012 Jun 18.

Imaging-based tumor treatment response evaluation: review of conventional, new, and emerging concepts

Affiliations
Review

Imaging-based tumor treatment response evaluation: review of conventional, new, and emerging concepts

Hee Kang et al. Korean J Radiol. 2012 Jul-Aug.

Abstract

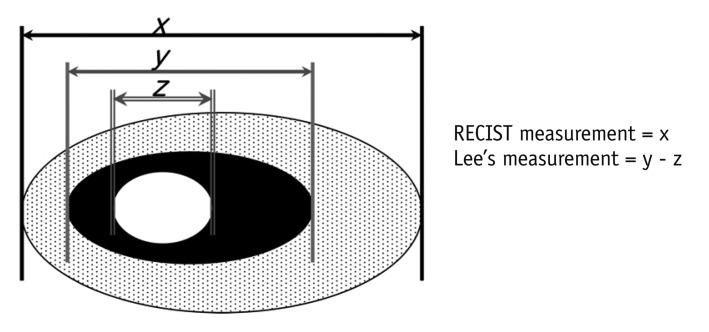
Tumor response may be assessed readily by the use of Response Evaluation Criteria in Solid Tumor version 1.1. However, the criteria mainly depend on tumor size changes. These criteria do not reflect other morphologic (tumor necrosis, hemorrhage, and cavitation), functional, or metabolic changes that may occur with targeted chemotherapy or even with conventional chemotherapy. The state-of-the-art multidetector CT is still playing an important role, by showing high-quality, high-resolution images that are appropriate enough to measure tumor size and its changes. Additional imaging biomarker devices such as dual energy CT, positron emission tomography, MRI including diffusion-weighted MRI shall be more frequently used for tumor response evaluation, because they provide detailed anatomic, and functional or metabolic change information during tumor treatment, particularly during targeted chemotherapy. This review elucidates morphologic and functional or metabolic approaches, and new concepts in the evaluation of tumor response in the era of personalized medicine (targeted chemotherapy).

Keywords: Oncology; Response Evaluation Criteria in Solid Tumor; Response assessment; Tumor response.


Figures

Fig. 1
Fig. 1
Patient with recurrent malignant gastrointestinal stromal tumor and multiple metastases. A. Contrast-enhancement axial CT scan in portal phase shows 25-mm-sized enhancing metastatic nodule in left hepatic lobe (arrow) and its mean CT number was measured 67 HU. B. Contrast-enhancement axial CT in portal phase scan obtained after chemotherapy shows metastatic nodule has not significantly decreased in size (25 mm in diameter) but demonstrates markedly decreased attenuation (34 HU) (arrow), suggesting tumor response.
Fig. 2
Fig. 2
Patient with non-small cell lung cancer. A. Pre-treatment contrast enhancement CT scan shows 41-mm-sized homogeneous enhancing mass (arrow) and malignant effusion in right pleural space. B. Post-treatment CT scan shows mass was not significantly changed in diameter (41 mm in diameter) but demonstrates heterogeneously decreased attenuation within tumor on contrast enhancement CT. This area shows increased attenuation of 54 HU (arrowheads) on non-contrast CT, suggesting internal hemorrhage. C. Mass has shrunk (17 mm in diameter) and demonstrates internal cavity formation, suggesting tumor necrosis on follow-up CT scan obtained after additional 2 cycles of target therapy.
Fig. 3
Fig. 3
Patient with epidermal growth factor receptor mutation positive lung adenocarcinoma (exon 19 microdeletion). A. Pretreatment CT scan on lung window image shows 11-mm and 8-mm-sized predominant solid nodules (arrows). B. CT scans obtained after 2 cycles of gene target therapy with Gefitinib (Irresa) shows that only ground-glass opacity components of lesions remain without significant change of diameter (arrowheads).
Fig. 4
Fig. 4
Patient with non-small cell lung cancer. Axial CT scans on lung window images before (A) and after (B) chemotherapy show internal cavity formation (arrow) due to necrosis of tumor.
Fig. 5
Fig. 5
Diagram depicting target lesion measurement by RECIST method and new response criteria (31). According to RECIST measurement, size of target lesion is measured by including both solid and ground-glass opacity components (x). According to our measurement, size of target lesion is measured by including solid component alone and by assessing size on mediastinal window images (y). If target lesion has internal cavitation, size of lesion is measured by including only soft-tissue wall thickness component and by excluding air component of cavity (subtraction of cavity diameter from longest diameter of cancer mass) (y - z). RECIST = Response Evaluation Criteria in Solid Tumor
Fig. 6
Fig. 6
Patient with breast cancer and bone metastasis. A. CT scans at baseline show partial osteolytic metastases (arrow) in thoracic vertebrae. B. After chemotherapy, osseous lesions have not changed in size, but show osteoblastic reaction (arrows in B), representing good response.
Fig. 7
Fig. 7
44-year-old woman with esophageal cancer and multiple metastases. Contrast-enhancement CT (A) and PET-CT (B) images obtained before chemotherapy show perigastric metastatic lymph node (white arrow) which was measured about 2 cm in diameter and shows intense FDG activity. Images obtained after treatment show lymph node was not changed in diameter (C) but SUVmax was markedly decreased from 8 to 1.9 on PET-CT (D). PET = positron emission tomography, FDG = fluorodeoxyglucose, SUVmax = maximum standardized uptake value
Fig. 8
Fig. 8
This figure shows how tumor thickness is measured according to modified RECIST, which has become standard protocol in mesothelioma tumor burden assessment. In this protocol, tumor thickness is measured perpendicularly to chest wall or mediastinum, not measuring tumor longest diameter. Sum of six measurement values from two different positions (white straight bars) at three different levels is used as "modified RECIST". RECIST = Response Evaluation Criteria in Solid Tumor
Fig. 9
Fig. 9
Malignant pleural mesothelioma of epithelioid subtype in 57-year-old man. A. Non-contrast axial CT scan obtained at level of aortic arch shows thickened (arrows) mediastinal and parietal pleurae. B. Co-registered PET-CT image shows how we measure metabolic tumor volume. Automatic VOIs with isocontour threshold method are placed over primary tumor. Segmented VOIs (arrows) are shown on axial PET-CT fusion image. SUVmax, SUVavg, and MTV are measured as 14.6, 4, and 508 mL, respectively. TLG were calculated as 2032 SUV·mL. VOI = volume of interest, SUVmax = maximum standardized uptake value, SUVavg = average standardized uptake value, MTV = metabolic tumor volume, total lesion glycolysis (TLG) = SUVavg × MTV
Fig. 10
Fig. 10
Patient with non-small cell lung cancer. A. DCE MR-derived Ktrans map before chemotherapy shows 26-mm-sized primary tumor colored in left upper lobe. B. Ktrans map after first-cycle of chemotherapy shows decrease in size (12 mm) and reduction in perfusion. C. Combined Ktrans histograms representing tumor perfusion before (blue) and after (red) first cycle of chemotherapy show modified perfusion distribution toward lower perfusion values. DCE = dynamic contrast enhancement
Fig. 11
Fig. 11
Patient with non-small cell lung cancer. Serial CT scans on lung window image, PET-CTs and ADC maps obtained before (A) and 5 weeks after (B) target therapy. There are no significant interval changes in diameter (18 mm in diameter) and FDG activity (ROI). But ADC map shows increase in mean ADC value from 1.21 to 1.42 (× 10-3 mm2/s) of tumor (arrowheads) after treatment over initial state, suggesting tumor necrosis after treatment. PET = positron emission tomography, ACD = apparent diffusion coefficient
Fig. 12
Fig. 12
Limitation of uni-dimensional measurement. A. Limitation of uni-dimensional measurement. Axial CT scans on lung window images in patient with non-small cell lung cancer before (B) and after (C) chemotherapy show decrease of 9.5% (from 4.2 cm to 3.8 cm) in long axis diameter however tumor shrunk by 74% (from 13.6 cm3 to 3.5 cm3) in volume, in actuality.

References

    1. Ratain MJ, Eckhardt SG. Phase II studies of modern drugs directed against new targets: if you are fazed, too, then resist RECIST. J Clin Oncol. 2004;22:4442–4445. - PubMed
    1. Rosner GL, Stadler W, Ratain MJ. Randomized discontinuation design: application to cytostatic antineoplastic agents. J Clin Oncol. 2002;20:4478–4484. - PubMed
    1. Miller AB, Hoogstraten B, Staquet M, Winkler A. Reporting results of cancer treatment. Cancer. 1981;47:207–214. - PubMed
    1. Therasse P, Arbuck SG, Eisenhauer EA, Wanders J, Kaplan RS, Rubinstein L, et al. New guidelines to evaluate the response to treatment in solid tumors. European Organization for Research and Treatment of Cancer, National Cancer Institute of the United States, National Cancer Institute of Canada. J Natl Cancer Inst. 2000;92:205–216. - PubMed
    1. Eisenhauer EA, Therasse P, Bogaerts J, Schwartz LH, Sargent D, Ford R, et al. New response evaluation criteria in solid tumours: revised RECIST guideline (version 1.1) Eur J Cancer. 2009;45:228–247. - PubMed

Substances