. 2010 May 19;1(5):366-80.
doi: 10.1021/cn900022w. Epub 2010 Feb 23.

Reduced 3,4-methylenedioxymethamphetamine (MDMA, Ecstasy)-initiated oxidative DNA damage and neurodegeneration in prostaglandin H synthase-1 knockout mice

Affiliations

Reduced 3,4-methylenedioxymethamphetamine (MDMA, Ecstasy)-initiated oxidative DNA damage and neurodegeneration in prostaglandin H synthase-1 knockout mice

Winnie Jeng et al. ACS Chem Neurosci. .

Abstract

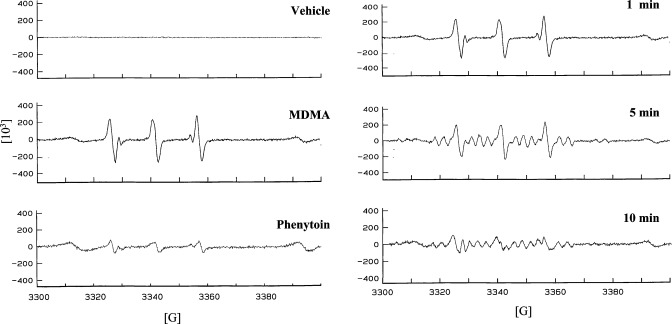
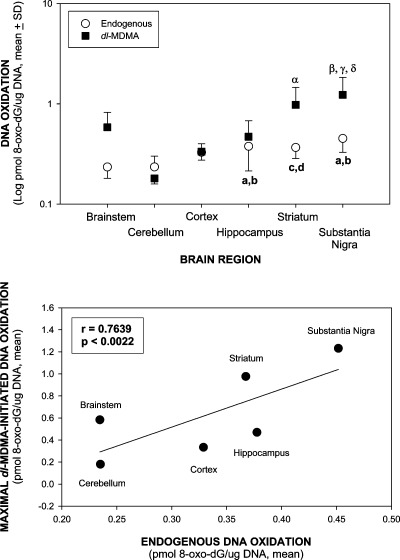
The neurodegenerative potential of 3,4-methylenedioxymethamphetamine (MDMA, ecstasy) and underlying mechanisms are under debate. Here, we show that MDMA is a substrate for CNS prostaglandin H synthase (PHS)-catalyzed bioactivation to a free radical intermediate that causes reactive oxygen species (ROS) formation and neurodegenerative oxidative DNA damage. In vitro PHS-1-catalyzed bioactivation of MDMA stereoselectively produced free radical intermediate formation and oxidative DNA damage that was blocked by the PHS inhibitor eicosatetraynoic acid. In vivo, MDMA stereoselectively caused gender-independent DNA oxidation and dopaminergic nerve terminal degeneration in several brain regions, dependent on regional PHS-1 levels. Conversely, MDMA-initiated striatal DNA oxidation, nerve terminal degeneration, and motor coordination deficits were reduced in PHS-1 +/- and -/- knockout mice in a gene dose-dependent fashion. These results confirm the neurodegenerative potential of MDMA and provide the first direct evidence for a novel molecular mechanism involving PHS-catalyzed formation of a neurotoxic MDMA free radical intermediate.

Keywords: 3,4-methylenedioxymethamphetamine; Ecstasy; neurodegeneration; oxidative DNA damage; prostaglandin H synthase; reactive oxygen species.


Figures

Figure 1
Figure 1
Electron paramagnetic resonance (EPR) spectra for in vitro PHS-1-catalyzed bioactivation of amphetamines to free radical intermediates. Left panel: vehicle control (upper panel), 3,4-methylenedioxymethamphetamine (dl-MDMA) (middle panel), and phenytoin (lower panel). Each reaction contained 1000U/mL PHS-1, 1.0 μM hematin, and 0.5 mM phenol. After preincubation for 1 min at 37 °C, 67 μM arachidonic acid, 1 mM PBN, and 1 mM of dl-MDMA were incubated for 1 min. The positive control phenytoin (0.5 mM) was incubated with PHS for 30 min as previously described (29). The vehicle control incubation contained all components except the drug. Right panel: time course for in vitro PHS-1-dependent MDMA free radical formation. Shown are the EPR spectra for the incubation of dl-MDMA for 1, 5, and 10 min with PHS-1.
Figure 2
Figure 2
In vitro PHS-1-dependent oxidation of DNA initiated by MDMA. Incubations (the number is indicated in parentheses) included 2′-deoxyguanosine (2′-dG), dl-MDMA or vehicle, PHS-1, hematin, and arachidonic acid as described in Figure 1 (excluding PBN). Phenytoin (PHT) was the positive control. Oxidative DNA damage was quantified by the formation of 8-oxo-2′-deoxyguanosine (8-oxo-dG). Upper panel: effect of drug concentration at 1 min. ap < 0.02, bp < 0.006, and cp < 0.009 compared to their vehicle control. *p < 0.02 compared to 0.25 mM PHT. Lower panel: effect of incubation time. cp < 0.009 compared to the vehicle control at the same incubation time point.
Figure 3
Figure 3
In vitro PHS-1-dependent oxidation of MDMA is inhibited by the PHS inhibitor 5,8,11,14-eicosatetraynoic acid (ETYA). Preincubation of the PHS/lipoxygenase inhibitor ETYA (40 μM) with PHS-1 abolished 8-oxo-dG formation for 1 mM dl-MDMA. Incubations (the number is indicated in parentheses) included 2′-dG, dl-MDMA or its saline vehicle, PHS-1, hematin, and arachidonic acid as described in Figure 1 (excluding PBN). One control incubation included DMSO, the vehicle for ETYA, containing all of the components excluding ETYA. ap < 0.001 compared to the saline vehicle, bp < 0.001 compared to MDMA, cp < 0.008 compared to the DMSO vehicle for ETYA.
Figure 4
Figure 4
Stereoselectivity in the PHS-1-dependent oxidation of DNA by MDMA enantiomers. Upper panel: in vitro PHS-1 oxidation of DNA by MDMA. d-MDMA or l-MDMA (1 mM) was incubated for 1 min with the components of the in vitro system as detailed in Figure 1 (excluding PBN) and analyzed for DNA oxidation. The number of incubations is indicated in parentheses. ap < 0.001 compared to the vehicle control; *p < 0.04 and **p < 0.001 compared to the l-enantiomer at the same concentration. Lower panel: PHS-1 knockout mice are protected against brain region-dependent in vivo oxidation of DNA by MDMA. dl-, d-, or l-MDMA were dissolved in 0.9% saline and administered in 4 doses (10 mg/kg ip) with each dose given at 2 h intervals. Saline was used as the control. The mice were sacrificed 1 h after the last injection, and tissues from different brain regions were isolated by microdissection and analyzed for oxidative DNA damage. A minimum of 6 mice were used for each group. 1,3p < 0.04, 2p < 0.002, 4p < 0.05, 5p < 0.03, and 6p < 0.03 compared to the corresponding saline-treated control for the same PHS-1 genotype. ap < 0.05 and bp < 0.02 compared to dl-MDMA-treated +/+ PHS-1-normal mice. αp < 0.009 and βp < 0.006 compared to d-MDMA-treated +/+ PHS-1-normal mice. Note the different scales for levels of DNA oxidation in different brain regions.
Figure 5
Figure 5
Relationship of baseline (constitutive or endogenous) and MDMA-enhanced DNA oxidation in brain regions of PHS-1 mice. Treatment and analysis of DNA oxidation is as described in Figure 4, lower panel. The constitutive levels represent the combined values for PHS-1 +/+, +/−, and −/− mice, which were identical for a given region. dl-MDMA-enhanced DNA oxidation was analyzed only in the PHS-1 +/+ mice, which was the only PHS-1 genotype exhibiting a significant increase in oxidative DNA damage. Upper panel: constitutive and dl-MDMA-enhanced DNA oxidation in different brain regions in PHS-1 mice. Lower panel: linear regression curve for constitutive and maximal dl-MDMA-initiated DNA oxidation (R = 0.7639, p < 0.0022). ap < 0.001 and cp < 0.001 compared to the brainstem and bp < 0.001 and dp < 0.001 compared to the cerebellum of constitutive brain regions. αp < 0.05 and βp < 0.001 compared to the cerebellum, γp < 0.01 compared to the cortex, and δp < 0.01 compared to the hippocampus of dl-MDMA-treated brain regions.
Figure 6
Figure 6
PHS-1 knockout mice are protected against d-MDMA-initiated persistent degeneration of dopaminergic nerve terminals in the striatum. Upper panel: d- (d) or l-MDMA (l) (10 mg/kg ip) was administered in 4 doses, each given at 2 h intervals. Saline (Sal) vehicle was used as the control. The mice were sacrificed 1 week after the last injection and perfused with 10% formalin. Brain sections were stained for tyrosine hydroxylase indicative of dopaminergic nerve terminals. Immunohistochemical staining is representative of n = 3/gender/treatment group; scale bar = 50 μm. Lower panel: quantification of immunohistochemical data reported in the upper panel. The number of animals is given in parentheses. ap < 0.001 and bp < 0.01 compared to the corresponding saline control for the same PHS-1 genotype; cp < 0.001, dp < 0.05 and ep < 0.01 compared to the corresponding d-MDMA-treated PHS-1 genotype; *p < 0.001 and **p < 0.05 compared to d-MDMA-treated wild-type PHS-1-normal mice; αp < 0.001 compared to d-MDMA-treated heterozygous PHS-1 knockout mice.
Figure 7
Figure 7
Slight long-term recovery of striatal dopaminergic nerve terminals in wild-type d-MDMA-treated PHS-1-normal mice. d-MDMA (10 mg/kg ip) was administered in 4 doses, each given at 2 h intervals. The mice were sacrificed 2 months after the last injection and perfused with 10% formalin. Brain sections were stained and quantified for tyrosine hydroxylase (TH), indicative of dopaminergic nerve terminals. The data were plotted as a percentage of TH staining in vehicle-treated wild-type mice (negative control). *p < 0.04 and **p < 0.01 compared to d-MDMA-treated wild-type PHS-1-normal mice sacrificed 1 week after the last injection (10 mg/kg ip). The number of mice is indicated in parentheses.
Figure 8
Figure 8
Female and male PHS-1 knockout mice are protected against d-MDMA-initiated persistent functional deficits. Motor coordination impairment was assessed by the rotarod test at 25 rpm for mice treated with d- or l-MDMA or their saline vehicle. The time at which the mice fell from the rod was recorded as the latency. A minimum of 4 mice were used per gender for each group. Left upper panel: d-MDMA compared to saline. 1p < 0.001 compared to its genotypically identical saline control. ap < 0.003, bp < 0.001, and cp < 0.04 compared to d-MDMA-treated +/− PHS-1 knockout mice. αp < 0.001 and βp < 0.002 compared to d-MDMA-treated −/− PHS-1 knockout mice. Left middle panel: l-MDMA compared to saline. No significant differences. Left lower panel: d-MDMA compared to its l-enantiomer. *p < 0.001, **p < 0.03, and ***p < 0.02 compared to l-MDMA-treated +/+ PHS-1-normal mice. Right upper panel: d-MDMA compared to saline. 1p < 0.001 and 2p < 0.004 compared to its genotypically matched saline control. bp < 0.03 compared to d-MDMA-treated +/− PHS-1 knockout mice. αp < 0.001, βp < 0.02, and γp < 0.03 compared to d-MDMA-treated −/− PHS-1 knockout mice. Right middle panel: l-MDMA compared to saline. No significant differences. Right lower panel: d-MDMA compared to its l-enantiomer. *p < 0.001 and **p < 0.006 compared to l-MDMA-treated +/+ PHS-1-normal mice.

Similar articles

Cited by

References

    1. Nichols D. E. (1986) Differences between the mechanism of action of MDMA, MBDB, and the classic hallucinogens. Identification of a new therapeutic class: entactogens. J. Psychoactive Drugs 18, 305–313. - PubMed
    1. Broening H. W.; Bowyer J. F.; Slikker W. (1995) Age-dependent sensitivity of rats to the long-term effects of the serotonergic neurotoxicant (±)-3,4-methylenedioxymethamphetamine (MDMA) correlates with the magnitude of the MDMA-induced thermal response. J. Pharmacol. Exp. Ther. 275, 325–333. - PubMed
    1. Kalant H. (2001) The pharmacology and toxicology of “ecstasy” (MDMA) and related drugs. CMAJ 165, 917–928. - PMC - PubMed
    1. Bolla K. I.; McCann U. D.; Ricaurte G. A. (1998) Memory impairment in abstinent MDMA (“Ecstasy”) users. Neurology 51, 1532–1537. - PubMed
    1. McGuire P. (2000) Long term psychiatric and cognitive effects of MDMA use. Toxicol. Lett. 112−113, 153–156. - PubMed

Publication types

MeSH terms