. 2010 Jun 16;1(6):420-34.
doi: 10.1021/cn100007x. Epub 2010 Mar 25.

Defining desirable central nervous system drug space through the alignment of molecular properties, in vitro ADME, and safety attributes

Affiliations

Defining desirable central nervous system drug space through the alignment of molecular properties, in vitro ADME, and safety attributes

Travis T Wager et al. ACS Chem Neurosci. .

Abstract

As part of our effort to increase survival of drug candidates and to move our medicinal chemistry design to higher probability space for success in the Neuroscience therapeutic area, we embarked on a detailed study of the property space for a collection of central nervous system (CNS) molecules. We carried out a thorough analysis of properties for 119 marketed CNS drugs and a set of 108 Pfizer CNS candidates. In particular, we focused on understanding the relationships between physicochemical properties, in vitro ADME (absorption, distribution, metabolism, and elimination) attributes, primary pharmacology binding efficiencies, and in vitro safety data for these two sets of compounds. This scholarship provides guidance for the design of CNS molecules in a property space with increased probability of success and may lead to the identification of druglike candidates with favorable safety profiles that can successfully test hypotheses in the clinic.

Keywords: CNS candidates; CNS drugs; Central nervous system (CNS); Madin−Darby canine kidney; P-glycoprotein; cellular toxicity; dofetilide binding; drug−drug interactions; high-throughput screening; human liver microsome stability; hydrogen bond donor; ligand efficiency; ligand-efficiency-dependent lipophilicity; ligand-lipophilicity efficiency; lipophilicity; molecular weight; most basic pKa; passive permeability; polarity; topological polar surface area; transformed human liver epithelial cells; unbound intrinsic clearance.


Figures

Figure 1
Figure 1
Physicochemical property distribution and statistics of drugs and candidates are shown for ClogP, ClogD, MW, TPSA, HBD, and pKa. N represents the number of compounds included in each analysis. Two-sided Student’s t test was applied to evaluate statistical significances of drugs and candidates.
Figure 2
Figure 2
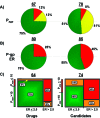
The distributions of Papp and P-gp efflux ratio of drugs and candidates. The numbers of compounds with measured data are highlighted above each graph. (A) The binned values of Papp obtained from the MDCK assay, color-coded by high permeability (Papp > 10, green), moderate permeability (2.5 < Papp ≤ 10, yellow), and low permeability (Papp ≤ 2.5, red) in the units of 10−6 cm/s. (B) The binned values for P-gp efflux liability, color-coded by low P-gp liability (P-gp ER ≤ 2.5, green) or high P-gp liability (P-gp ER > 2.5, red). (C) Mosaic plots of molecules with both Papp and P-gp data. Green blocks represent the percentages of molecules with both attributes (high Papp and low P-gp liability), the orange blocks represent percentages of molecules with only one attribute (high Papp or low P-pg liability), and the red blocks represent the molecules with neither high Papp nor low P-gp.
Figure 3
Figure 3
The distribution of binned clearance (CLint,u) of drugs and candidates, color-coded by low clearance (CLint,u ≤ 100 mL/(min·kg), green) and high clearance (CLint,u > 100 mL/(min·kg), red).
Figure 4
Figure 4
ADME attribute alignment of drugs and candidates, color-coded by the count of achieving the following criteria: high permeability (Papp > 10 × 10−6 cm/s), low P-gp liability (≤ 2.5), and low clearance (CLint,u ≤ 100 mL/(min·kg)). Colors are as follows: full alignment with 3/3 attributes achieved (green), 2/3 attributes achieved (yellow), 1/3 attributes achieved (red), 0/3 attributes achieved (gray).
Figure 5
Figure 5
LE, LLE, and LELP distributions and statistics are shown for 95 drugs and 107 candidates with primary pharmacologic potency data. Two-sided Student’s t test was applied to test the difference between drugs and candidates.
Figure 6
Figure 6
The relationship between ligand efficiency (LE) and ligand-lipophilicity efficiency (LLE) of drugs and candidates is shown. The plot is guided by 25th percentiles (orange lines) and 75th percentiles (blue lines) of LE and LLE for the drug set. Compounds in the upper right square are compounds considered to have both high LE and LLE, and compounds occupying the lower left square are considered to have low LE and LLE.
Figure 7
Figure 7
Drug and candidate distribution of potential drug−drug interactions (DDI) for (A) CYP2D6 and (B) CYP3A4. Results are displayed as percent inhibition (% inh) of reference control substrate metabolism and are interpreted as follows with regard to risk for DDI: % inh ≤ 25 (low risk, green), 25 < % inh ≤ 75 (moderate risk, yellow), % inh > 75 (high risk, red) for both CYP2D6 and CYP3A4 substrates.
Figure 8
Figure 8
Analysis of percent inhibition (% inh) of dofetilide binding for drugs and candidates. The pie charts display color-coded potential risk of hERG interaction: low risk (% inh ≤ 15, green), moderate risk (15 < % inh ≤ 50%, yellow), high risk (% inh > 50, red). (A) Distribution of binned dofetilide binding for both drugs and candidates. (B) The binned dofetilide binding of drugs and candidates was further grouped by ClogP: ClogP ≤ 3 and ClogP > 3.
Figure 9
Figure 9
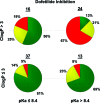
Dofetilide inhibition data for the drug set versus ClogP and pKa. Drugs with both higher ClogP and higher pKa had a significantly increased percentage of compounds with high binding (>50% inh) to the dofetilide site compared with those with low ClogP and low pKa. The pie charts are color-coded by potential risk of hERG channel blockade: low risk (% inh ≤15, green), moderate risk (15 < % inh ≤ 50, yellow), high risk (% inh >50, red).
Figure 10
Figure 10
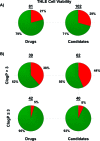
Distribution of THLE Cv of drugs and candidates as measured by an ATP depletion assay. Results are color-coded by high cell viability (IC50 > 100 μM, green) and low cell viability (IC50 ≤ 100 μM, red). (A) Overall distribution of THLE Cv for the drug and candidate set. (B) Segregation of THLE Cv data into high and low lipophilicity bins.
Figure 11
Figure 11
Partitioning of THLE Cv data for the drug set by ClogP and MW. The charts are color-coded by high cell viability (IC50 > 100 μM, green) and low cell viability (IC50 ≤ 100 μM, red).
Figure 12
Figure 12
Safety attribute alignments of drugs and candidates, color-coded by the number of times a molecule achieved low DDI for both 2D6 and 3A4, low dofetilide binding, or high THLE Cv: full alignment (3/3) attributes (green), 2/3 attributes (yellow), 1/3 attributes (red), 0/3 attributes (gray).
Figure 13
Figure 13
Plots of ADME attribute alignment vs safety attribute alignment for the drug and candidate sets. The drugs with full alignment (6/6) of ADME and safety attributes are exemplified.
Figure 14
Figure 14
Drug optimum values.

Similar articles

Cited by

References

    1. Kola I.; Landis J. (2004) Opinion: Can the pharmaceutical industry reduce attrition rates?. Nat. Rev. Drug Discovery 3, 711–716. - PubMed
    1. O'Shea R.; Moser H. E. (2008) Physicochemical properties of antibacterial compounds: Implications for drug discovery. J. Med. Chem. 51, 2871–2878. - PubMed
    1. Leeson Paul D.; Davis Andrew M. (2004) Time-related differences in the physical property profiles of oral drugs. J. Med. Chem. 47, 6338–6348. - PubMed
    1. Veber D. F.; Johnson S. R.; Cheng H.-Y.; Smith B. R.; Ward K. W.; Kopple K. D. (2002) Molecular properties that influence the oral bioavailability of drug candidates. J. Med. Chem. 45, 2615–2623. - PubMed
    1. Proudfoot J. R. (2005) The evolution of synthetic oral drug properties. Bioorg. Med. Chem. Lett. 15, 1087–1090. - PubMed

Substances