. 2010 Jun 16;1(6):435-49.
doi: 10.1021/cn100008c. Epub 2010 Mar 25.

Moving beyond rules: the development of a central nervous system multiparameter optimization (CNS MPO) approach to enable alignment of druglike properties

Affiliations

Moving beyond rules: the development of a central nervous system multiparameter optimization (CNS MPO) approach to enable alignment of druglike properties

Travis T Wager et al. ACS Chem Neurosci. .

Abstract

The interplay among commonly used physicochemical properties in drug design was examined and utilized to create a prospective design tool focused on the alignment of key druglike attributes. Using a set of six physicochemical parameters ((a) lipophilicity, calculated partition coefficient (ClogP); (b) calculated distribution coefficient at pH = 7.4 (ClogD); (c) molecular weight (MW); (d) topological polar surface area (TPSA); (e) number of hydrogen bond donors (HBD); (f) most basic center (pK(a))), a druglikeness central nervous system multiparameter optimization (CNS MPO) algorithm was built and applied to a set of marketed CNS drugs (N = 119) and Pfizer CNS candidates (N = 108), as well as to a large diversity set of Pfizer proprietary compounds (N = 11 303). The novel CNS MPO algorithm showed that 74% of marketed CNS drugs displayed a high CNS MPO score (MPO desirability score ≥ 4, using a scale of 0-6), in comparison to 60% of the Pfizer CNS candidates. This analysis suggests that this algorithm could potentially be used to identify compounds with a higher probability of successfully testing hypotheses in the clinic. In addition, a relationship between an increasing CNS MPO score and alignment of key in vitro attributes of drug discovery (favorable permeability, P-glycoprotein (P-gp) efflux, metabolic stability, and safety) was seen in the marketed CNS drug set, the Pfizer candidate set, and the Pfizer proprietary diversity set. The CNS MPO scoring function offers advantages over hard cutoffs or utilization of single parameters to optimize structure-activity relationships (SAR) by expanding medicinal chemistry design space through a holistic assessment approach. Based on six physicochemical properties commonly used by medicinal chemists, the CNS MPO function may be used prospectively at the design stage to accelerate the identification of compounds with increased probability of success.

Keywords: CNS MPO; CNS candidates; CNS drugs; Harrington optimization; Madin−Darby canine kidney; Multiparameter optimization (MPO); P-glycoprotein; Unbound intrinsic clearance; cellular toxicity; central nervous system (CNS); desirability score; dofetilide binding; drug−drug interactions; high-throughput screening; human liver microsome stability; hydrogen bond donor; lipophilicity; molecular weight; most basic pKa; multivariant optimization; passive permeability; polarity; topological polar surface area; transformed human liver epithelial cells.


Figures
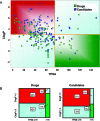
Figure 1
Figure 1
(A) Distribution of drugs and candidates in the ClogP and TPSA space. Orange lines represent the cutoff values for ClogP (3) and TPSA (75 Å2) relative risk factors. Compounds are colored by compound type: drugs are shown in light green and candidates in dark blue. Compounds in the lower right quadrant (ClogP < 3 and TPSA > 75 Å2) are considered to have lower risk for adverse safety findings. (B) Mosaic plots of drugs and candidates. Green boxes represent the percentage of compounds within the low-risk safety space (ClogP < 3 and TPSA > 75 Å2), and the red boxes represent the compounds in higher risk space (ClogP > 3 and TPSA < 75 Å2). The number in each box reflects the percentage of compounds in that category.
Figure 2
Figure 2
The distribution of binned P-gp efflux ratios (ER) obtained from the MDCK-MDR1 assay (low P-gp liability, ER ≤ 2.5, green; high P-gp liability, ER > 2.5, red) for the diverse pool set across a range of ClogP values. The number of compounds represented by each pie is shown above the pie graph.
Figure 3
Figure 3
Desirability component functions are defined by a set of inflection points; higher y values represent more desirable regions: (A) a monotonic decreasing function is defined by two inflection points; (B) a hump function is defined by four inflection points.
Figure 4
Figure 4
Each plot represents one of the six physicochemical property desirability functions used to generate the CNS MPO. Each point on a plot represents a drug or candidate: (A) ClogP; (B) ClogD; (C) MW; (D) TPSA; (E) HBD; (F) pKa. The most desirable (T0 = 1.0) and least desirable (T0 = 0.0) inflection points are marked with green and red arrows, respectively. A linear function was used to determine the desirability scores between the inflection points.
Figure 5
Figure 5
CNS MPO scores for drugs (green bars) and candidates (blue bars) were plotted from low to high CNS MPO score along the x-axis. The compound count for each bin appears above the bar.
Figure 6
Figure 6
Distribution of ADME and safety attributes for drugs and candidates as a function of the CNS MPO score: (A) binned values for Papp obtained from the MDCK assay, color-coded by high permeability (Papp > 10, green), moderate permeability (2.5 < Papp ≤ 10, yellow), and low permeability (Papp ≤ 2.5, red) in units of 10−6 cm/s; (B) binned values for P-gp efflux liability obtained from the MDCK-MDR1 assay, color-coded by low P-gp liability (ER ≤ 2.5, green) or high P-gp liability (ER > 2.5, red); (C) binned values for clearance (CLint,u) assessed in a human liver microsome stability assay, color-coded by low clearance (CLint,u ≤ 100 mL/(min·kg), green) and high clearance (CLint,u > 100 mL/(min·kg), red); (D) binned values for THLE Cv as measured by an ATP depletion assay, color-coded by high cell viability (IC50 > 100 μM, green) and low cell viability (IC50 ≤ 100 μM, red). Pie charts are color-coded based on the value of the bin, from desirable values (green) to undesirable values (red), and sized by the number of compounds in each pie, which is shown above each pie graph.
Figure 7
Figure 7
Plots of property space for the diverse pool set, where each square represents a compound: (A) plot of ClogP vs TPSA; (B) plot of ClogD vs MW; (C) plot of HBD vs pKa, where HBD are jittered.
Figure 8
Figure 8
Distribution of ADME and safety attributes as a function of the CNS MPO desirability score for a large and diverse set of compounds. Binned values are shown for (A) passive permeability, Papp; (B) P-gp liability efflux, P-gp; (C) metabolic stability, CLint,u; and (D) inhibition of dofetilide, Dof. Pie charts are color-coded based on the value of each bin, from desirable values (green) to undesirable values (red), and the number of compounds in each pie is shown above the respective pie graph.
Figure 9
Figure 9
Pie chart of binned values for alignment of desired ADME attributes: high Papp, low P-gp, and low CLint,u. Color-coding for desired ADME attributes: 3/3 (green), 2/3 (yellow), 1/3 (red), and no attributes (black). Binned CNS MPO scores are plotted along the x-axis, and drug, candidate, and diverse pool sets are plotted along the y-axis. The number of compounds in each pie is given above the pie graph.
Figure 10
Figure 10
The CNS MPO algorithm expands design space while maintaining alignment of desired attributes. Plots display the distribution of compounds from the diverse set that possess full alignment of ADME properties against each of six physicochemical properties (ClogP, ClogD, TPSA, MW, HBD, pKa) in relationship to their CNS MPO desirability scores. Orange lines represent potential hard cutoffs, where hard cutoffs in this example were defined by the CNS MPO optimal property values, for each of the physicochemical properties: ClogP = 3; ClogD = 2; TPSA, high value = 90 Å2 and low value = 40 Å2; MW = 360; HBD = 0.5; and pKa = 8.

Similar articles

Cited by

References

    1. Kola I.; Landis J. (2004) Opinion: Can the pharmaceutical industry reduce attrition rates?. Nat. Rev. Drug Discovery 3, 711–716. - PubMed
    1. Leeson P. D.; Springthorpe B. (2007) The influence of drug-like concepts on decision-making in medicinal chemistry. Nat. Rev. Drug Discovery 6, 881–890. - PubMed
    1. Abad-Zapatero C. (2007) Ligand efficiency indices for effective drug discovery. Expert Opin. Drug Discovery 2, 469–488. - PubMed
    1. Keserue G. M.; Makara G. M. (2009) The influence of lead discovery strategies on the properties of drug candidates. Nat. Rev. Drug Discovery 8, 203–212. - PubMed
    1. Kalgutkar A. S. (2008) Role of bioactivation in idiosyncratic drug toxicity: Structure-toxicity relationships. Biotechnol.: Pharm. Aspects 9, 27–55.

MeSH terms

Substances