

Oral treatment with the d-enantiomeric peptide D3 improves the pathology and behavior of Alzheimer's Disease transgenic mice
- PMID: 22778851
- PMCID: PMC3368690
- DOI: 10.1021/cn100057j
Oral treatment with the d-enantiomeric peptide D3 improves the pathology and behavior of Alzheimer's Disease transgenic mice
Abstract
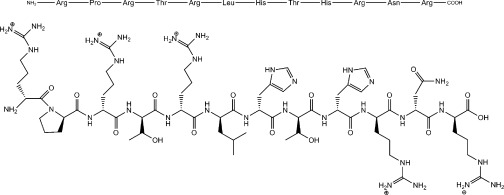
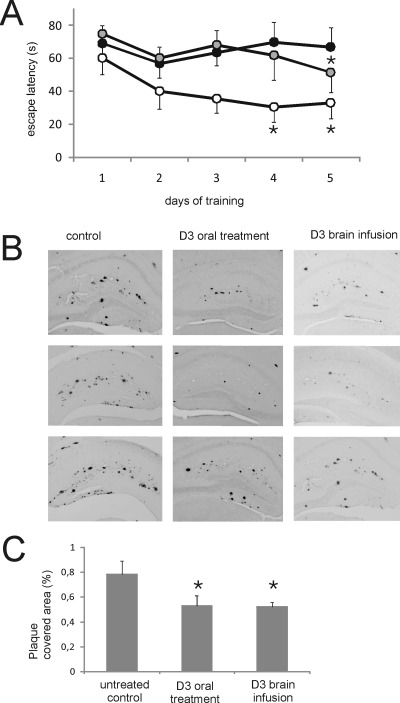
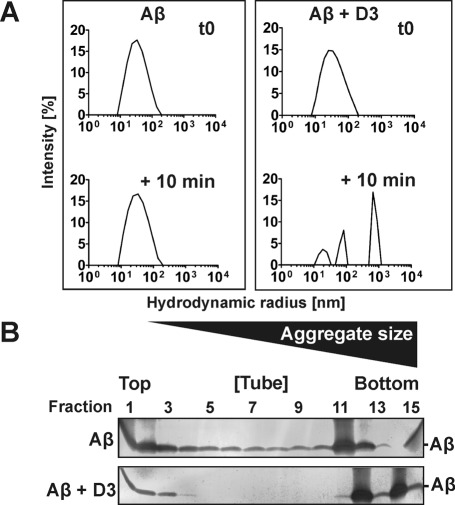
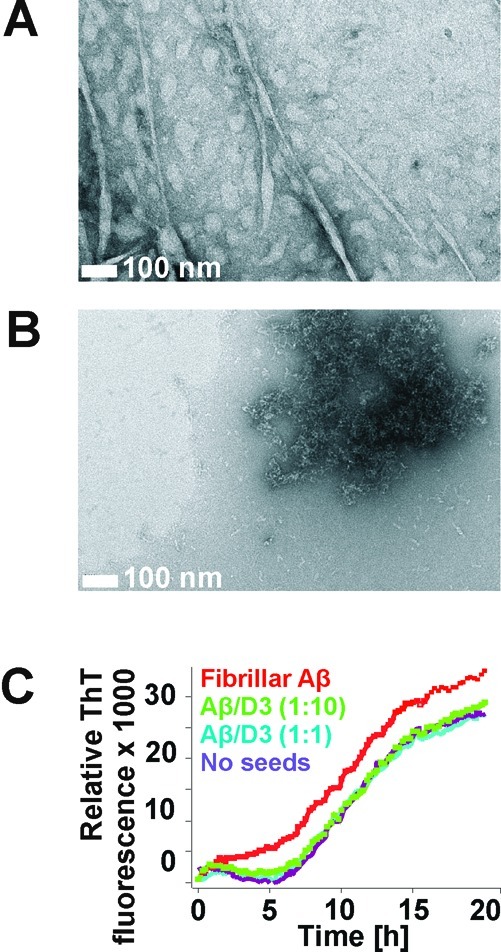
Several lines of evidence suggest that the amyloid-β-peptide (Aβ) plays a central role in the pathogenesis of Alzheimer's disease (AD). Not only Aβ fibrils but also small soluble Aβ oligomers in particular are suspected to be the major toxic species responsible for disease development and progression. The present study reports on in vitro and in vivo properties of the Aβ targeting d-enantiomeric amino acid peptide D3. We show that next to plaque load and inflammation reduction, oral application of the peptide improved the cognitive performance of AD transgenic mice. In addition, we provide in vitro data elucidating the potential mechanism underlying the observed in vivo activity of D3. These data suggest that D3 precipitates toxic Aβ species and converts them into nonamyloidogenic, nonfibrillar, and nontoxic aggregates without increasing the concentration of monomeric Aβ. Thus, D3 exerts an interesting and novel mechanism of action that abolishes toxic Aβ oligomers and thereby supports their decisive role in AD development and progression.
Keywords: Alzheimer’s disease; Mirror image phage display; d-enantiomeric peptide; drugs; oligomers.
Figures
Similar articles
-
Large-Scale Oral Treatment Study with the Four Most Promising D3-Derivatives for the Treatment of Alzheimer's Disease.Molecules. 2017 Oct 10;22(10):1693. doi: 10.3390/molecules22101693. Molecules. 2017. PMID: 28994710 Free PMC article.
-
Increase of Positive Net Charge and Conformational Rigidity Enhances the Efficacy of d-Enantiomeric Peptides Designed to Eliminate Cytotoxic Aβ Species.ACS Chem Neurosci. 2016 Aug 17;7(8):1088-96. doi: 10.1021/acschemneuro.6b00047. Epub 2016 Jun 9. ACS Chem Neurosci. 2016. PMID: 27240424
-
Treatment with D3 removes amyloid deposits, reduces inflammation, and improves cognition in aged AβPP/PS1 double transgenic mice.J Alzheimers Dis. 2013;34(3):609-20. doi: 10.3233/JAD-121792. J Alzheimers Dis. 2013. PMID: 23271316 Free PMC article.
-
Elucidating the Structures of Amyloid Oligomers with Macrocyclic β-Hairpin Peptides: Insights into Alzheimer's Disease and Other Amyloid Diseases.Acc Chem Res. 2018 Mar 20;51(3):706-718. doi: 10.1021/acs.accounts.7b00554. Epub 2018 Mar 6. Acc Chem Res. 2018. PMID: 29508987 Free PMC article. Review.
-
Beneficial Effects of Walnuts on Cognition and Brain Health.Nutrients. 2020 Feb 20;12(2):550. doi: 10.3390/nu12020550. Nutrients. 2020. PMID: 32093220 Free PMC article. Review.
Cited by
-
d-Amino Acid Pseudopeptides as Potential Amyloid-Beta Aggregation Inhibitors.Molecules. 2018 Sep 18;23(9):2387. doi: 10.3390/molecules23092387. Molecules. 2018. PMID: 30231520 Free PMC article.
-
Peptides as Potential Therapeutics for Alzheimer's Disease.Molecules. 2018 Jan 30;23(2):283. doi: 10.3390/molecules23020283. Molecules. 2018. PMID: 29385735 Free PMC article. Review.
-
Advances in Alzheimer's Disease-Associated Aβ Therapy Based on Peptide.Int J Mol Sci. 2023 Aug 23;24(17):13110. doi: 10.3390/ijms241713110. Int J Mol Sci. 2023. PMID: 37685916 Free PMC article. Review.
-
An intranasally delivered peptide drug ameliorates cognitive decline in Alzheimer transgenic mice.EMBO Mol Med. 2017 May;9(5):703-715. doi: 10.15252/emmm.201606666. EMBO Mol Med. 2017. PMID: 28356312 Free PMC article.
-
Structural Insights into Curli CsgA Cross-β Fibril Architecture Inspire Repurposing of Anti-amyloid Compounds as Anti-biofilm Agents.PLoS Pathog. 2019 Aug 30;15(8):e1007978. doi: 10.1371/journal.ppat.1007978. eCollection 2019 Aug. PLoS Pathog. 2019. PMID: 31469892 Free PMC article.
References
-
- Brookmeyer R.; Johnson E.; Ziegler-Graham K.; Arrighi H. M. (2007) Forecasting the global burden of Alzheimer’s disease. Alzheimer's Dementia 3, 186–191. - PubMed
-
- Haass C.; Selkoe D. J. (1993) Cellular processing of beta-amyloid precursor protein and the genesis of amyloid beta-peptide. Cell 75, 1039–1042. - PubMed
-
- Kang J.; Lemaire H. G.; Unterbeck A.; Salbaum J. M.; Masters C. L.; Grzeschik K. H.; Multhaup G.; Beyreuther K.; Muller-Hill B. (1987) The precursor of Alzheimer’s disease amyloid A4 protein resembles a cell-surface receptor. Nature 325, 733–736. - PubMed
-
- Weidemann A.; Konig G.; Bunke D.; Fischer P.; Salbaum J. M.; Masters C. L.; Beyreuther K. (1989) Identification, biogenesis, and localization of precursors of Alzheimer’s disease A4 amyloid protein. Cell 57, 115–126. - PubMed
-
- Hardy J. A.; Higgins G. A. (1992) Alzheimer’s disease: the amyloid cascade hypothesis. Science 256, 184–185. - PubMed
Publication types
MeSH terms
Substances
LinkOut - more resources
Full Text Sources
Other Literature Sources
Medical
Molecular Biology Databases
