

Infrared microspectroscopy: a multiple-screening platform for investigating single-cell biochemical perturbations upon prion infection
- PMID: 22778865
- PMCID: PMC3369737
- DOI: 10.1021/cn1000952
Infrared microspectroscopy: a multiple-screening platform for investigating single-cell biochemical perturbations upon prion infection
Abstract
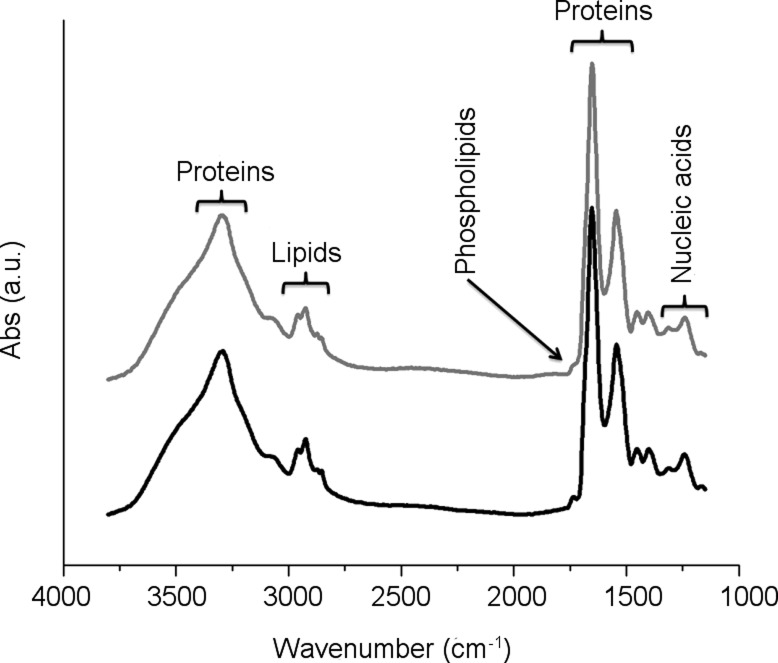
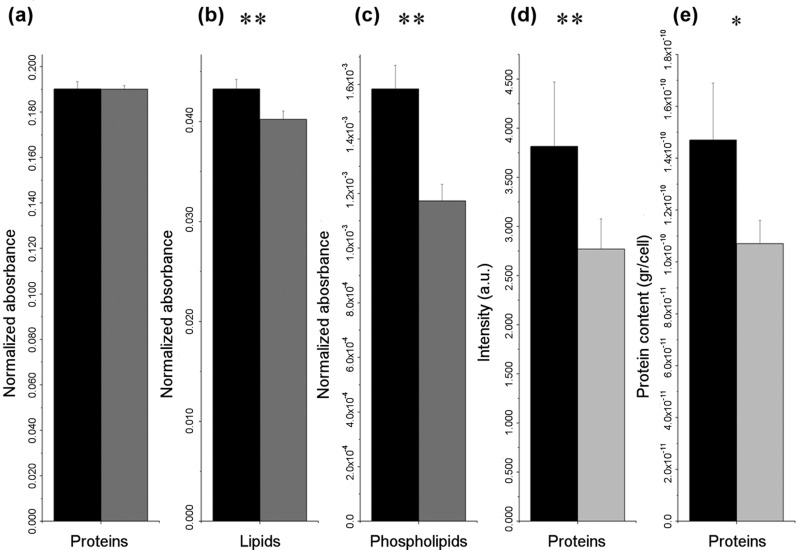
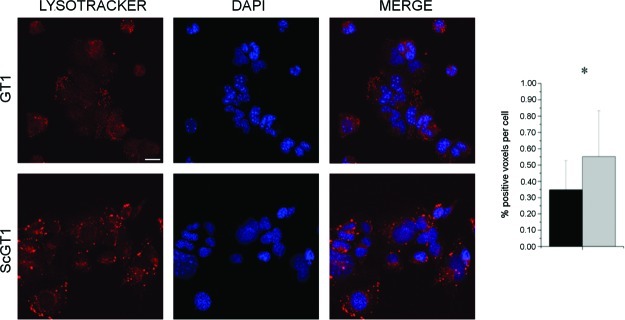
Prion diseases are a group of fatal neurodegenerative disorders characterized by the accumulation of prions in the central nervous system. The pathogenic prion (PrP(Sc)) possesses the capability to convert the host-encoded cellular isoform of the prion protein, PrP(C), into nascent PrP(Sc). The present work aims at providing novel insight into cellular response upon prion infection evidenced by synchrotron radiation infrared microspectroscopy (SR-IRMS). This non-invasive, label-free analytical technique was employed to investigate the biochemical perturbations undergone by prion infected mouse hypothalamic GT1-1 cells at the cellular and subcellular level. A decrement in total cellular protein content upon prion infection was identified by infrared (IR) whole-cell spectra and validated by bicinchoninic acid assay and single-cell volume analysis by atomic force microscopy (AFM). Hierarchical cluster analysis (HCA) of IR data discriminated between infected and uninfected cells and allowed to deduce an increment of lysosomal bodies within the cytoplasm of infected GT1-1 cells, a hypothesis further confirmed by SR-IRMS at subcellular spatial resolution and fluorescent microscopy. The purpose of this work, therefore, consists of proposing IRMS as a powerful multiscreening platform, drawing on the synergy with conventional biological assays and microscopy techniques in order to increase the accuracy of investigations performed at the single-cell level.
Keywords: PrPSc; Prion; atomic force microscopy; chemical mapping; infrared microspectroscopy; synchrotron radiation.
Figures


Similar articles
-
FTIR-microspectroscopy of prion-infected nervous tissue.Biochim Biophys Acta. 2006 Jul;1758(7):948-59. doi: 10.1016/j.bbamem.2006.05.026. Epub 2006 Jun 7. Biochim Biophys Acta. 2006. PMID: 16887095 Review.
-
An astrocyte cell line that differentially propagates murine prions.J Biol Chem. 2020 Aug 14;295(33):11572-11583. doi: 10.1074/jbc.RA120.012596. Epub 2020 Jun 19. J Biol Chem. 2020. PMID: 32561641 Free PMC article.
-
Establishment of a simple cell-based ELISA for the direct detection of abnormal isoform of prion protein from prion-infected cells without cell lysis and proteinase K treatment.Prion. 2016 Jul 3;10(4):305-18. doi: 10.1080/19336896.2016.1189053. Prion. 2016. PMID: 27565564 Free PMC article.
-
Sc237 hamster PrPSc and Sc237-derived mouse PrPSc generated by interspecies in vitro amplification exhibit distinct pathological and biochemical properties in tga20 transgenic mice.Microbiol Immunol. 2011 May;55(5):331-40. doi: 10.1111/j.1348-0421.2011.00328.x. Microbiol Immunol. 2011. PMID: 21362027
-
Cellular and sub-cellular pathology of animal prion diseases: relationship between morphological changes, accumulation of abnormal prion protein and clinical disease.Acta Neuropathol. 2011 Jan;121(1):113-34. doi: 10.1007/s00401-010-0700-3. Epub 2010 Jun 8. Acta Neuropathol. 2011. PMID: 20532540 Review.
Cited by
-
Prion protein and its role in signal transduction.Cell Mol Biol Lett. 2013 Jun;18(2):209-30. doi: 10.2478/s11658-013-0085-0. Epub 2013 Mar 11. Cell Mol Biol Lett. 2013. PMID: 23479001 Free PMC article. Review.
-
Differential protein folding and chemical changes in lung tissues exposed to asbestos or particulates.Sci Rep. 2015 Jul 10;5:12129. doi: 10.1038/srep12129. Sci Rep. 2015. PMID: 26159651 Free PMC article.
-
Time lapse synchrotron IR chemical imaging for observing the acclimation of a single algal cell to CO2 treatment.Sci Rep. 2021 Jun 24;11(1):13246. doi: 10.1038/s41598-021-92657-3. Sci Rep. 2021. PMID: 34168226 Free PMC article.
-
Synchrotron infrared imaging of advanced glycation endproducts (AGEs) in cardiac tissue from mice fed high glycemic diets.Biomed Spectrosc Imaging. 2013;2(4):301-315. doi: 10.3233/BSI-130057. Biomed Spectrosc Imaging. 2013. PMID: 26500847 Free PMC article.
References
-
- Fasano C.; Campana V.; Zurzolo C. (2006) Prions: protein only or something more? Overview of potential prion cofactors. J. Mol. Neurosci. 29, 195–214. - PubMed
-
- Lee K. S.; Linden R.; Prado M. A.; Brentani R. R.; Martins V. R. (2003) Towards cellular receptors for prions. Rev. Med. Virol. 13, 399–408. - PubMed
Publication types
MeSH terms
Substances
LinkOut - more resources
Full Text Sources
Research Materials
Miscellaneous
