

The development of growth references and growth charts
- PMID: 22780429
- PMCID: PMC3920659
- DOI: 10.3109/03014460.2012.694475
The development of growth references and growth charts
Abstract
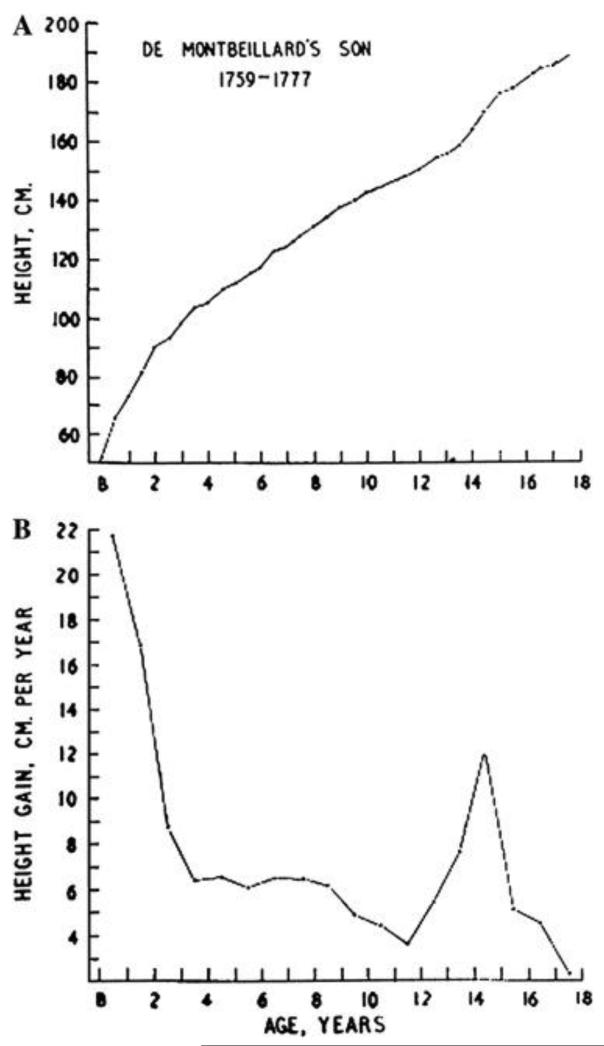
Context: De Montbeillard produced the first growth chart in the late 18(th) century. Since then, growth assessment has developed to become an essential component of child health practice.
Objective: To provide a brief history of (i) anthropometry, i.e. growth measurements; (ii) growth references, the statistical summary of anthropometry and (iii) growth charts, the visual representation of growth references for clinical use.
Methods: The major contributors in the three categories over the past 200 years were identified and their historical contributions put in context with more recent developments.
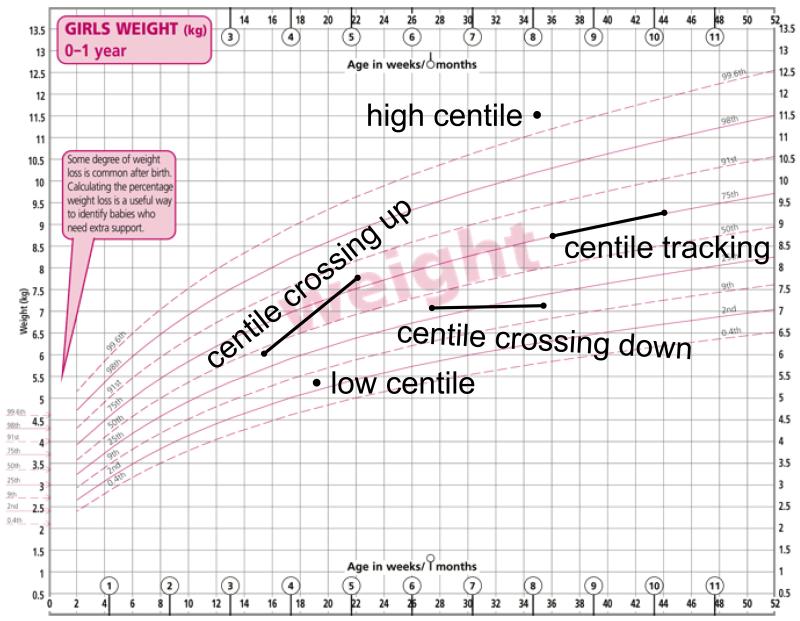
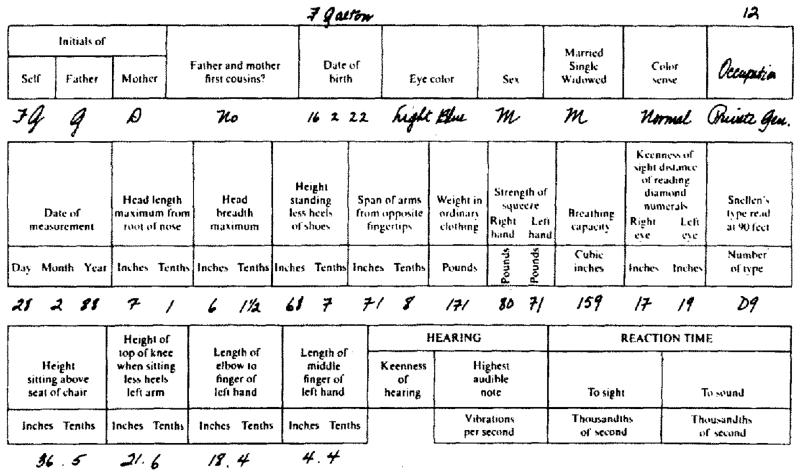
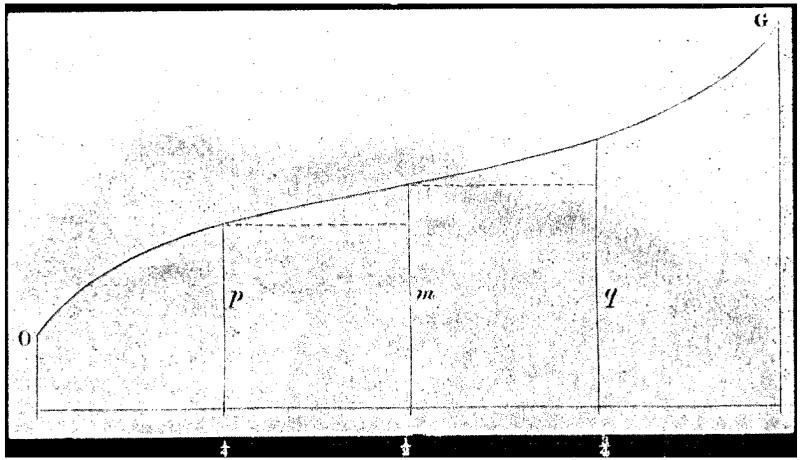
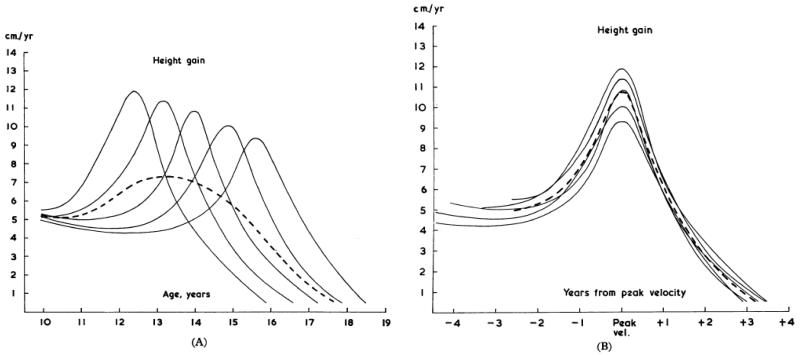
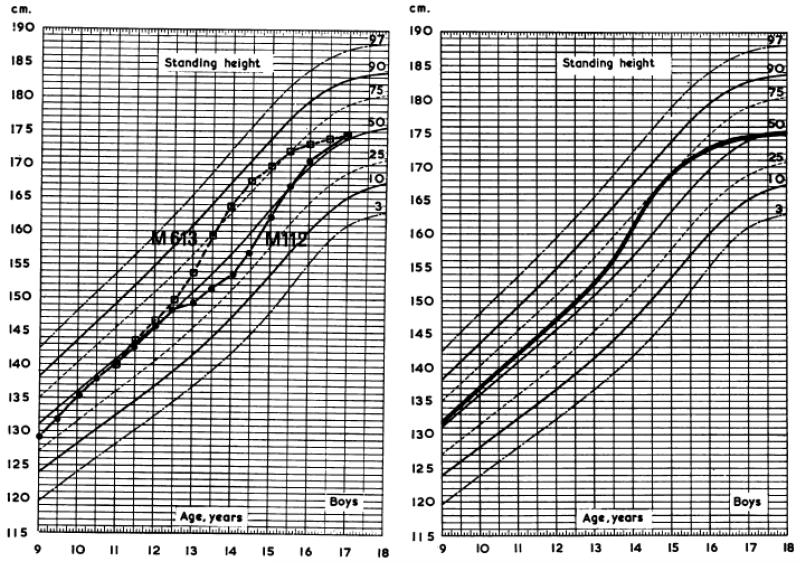
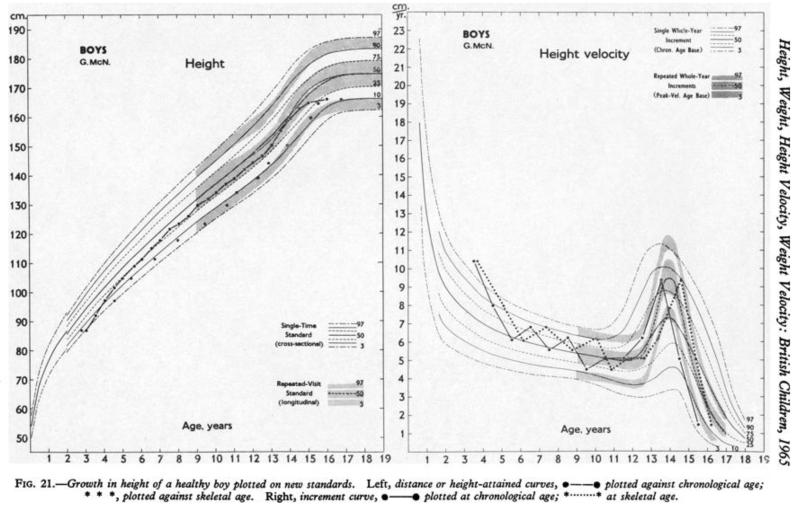
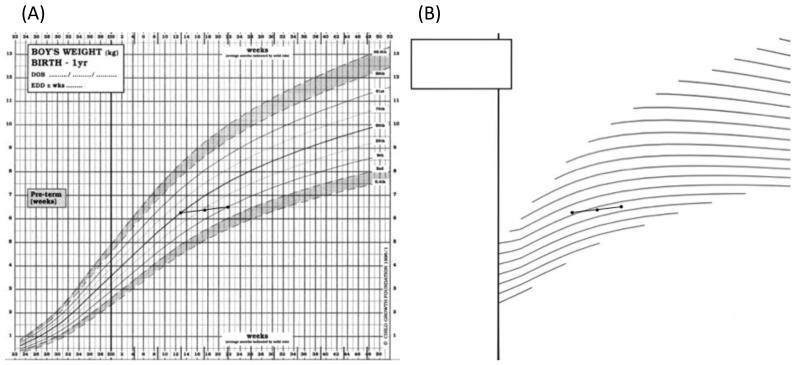
Results: Anthropometry was originally collected for administrative or public health purposes, its medical role emerging at the end of the 19(th) century. Growth reference data were collected in earnest from the 19(th) century, during which time the familiar statistical summary statistics-mean, SD, centiles-were developed. More advanced statistical methods emerged much later. Growth charts first appeared in the late 19(th) century and Tanner and Whitehouse later popularized the concepts of velocity and conditional references for growth in puberty. An important recent reference is the WHO growth standard, which documents optimal growth and has been adopted by many countries including the UK. Arising from it, the UK-WHO charts have pioneered many design features to improve usability and accuracy.
Conclusion: Growth charts have developed considerably in 200 years and they represent an impressive synthesis of anthropometry, statistical summary and chart design.
Figures
References
-
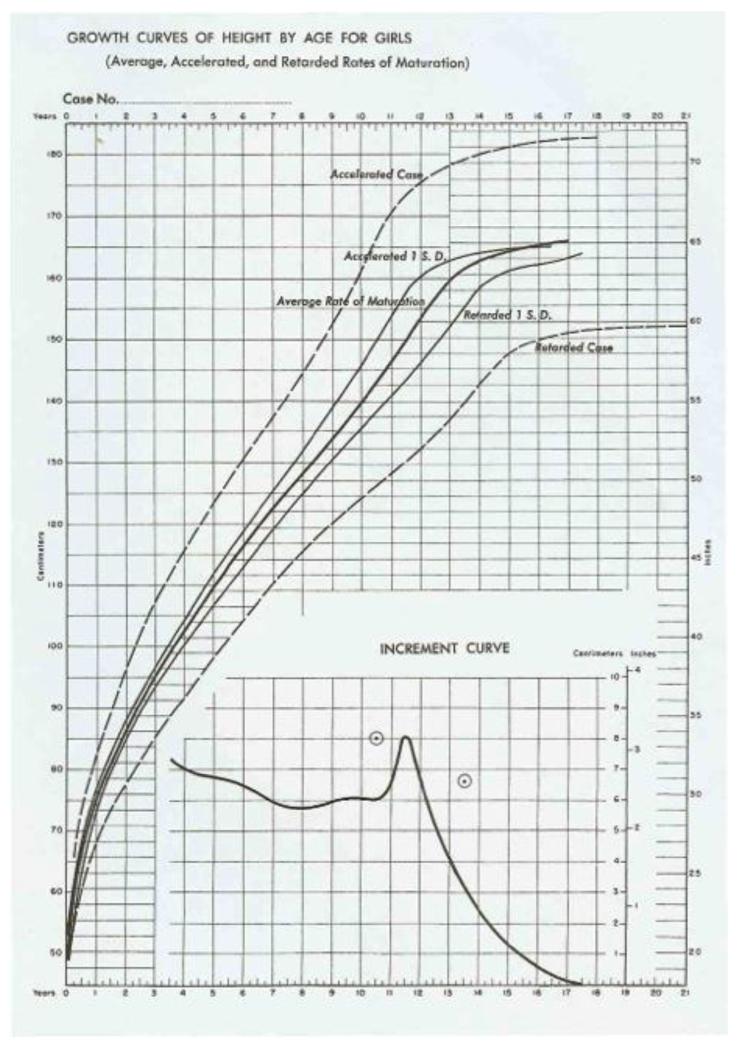
- Bayer LM, Bayley N. Growth diagnosis. University of Chicago Press; Chicago: 1959.
-
- Binns C, James J, Lee MK. Why the new WHO growth charts are dangerous to breastfeeding. Breastfeeding Review. 2008;16:5–7. - PubMed
-
- Borghi E, de Onis M, Garza C, Van den Broeck J, Frongillo EA, Grummer-Strawn L, Van Buuren S, Pan H, Molinari L, Martorell R, et al. Construction of the World Health Organization child growth standards: selection of methods for attained growth curves. Stat Med. 2006;25:247–265. - PubMed
-
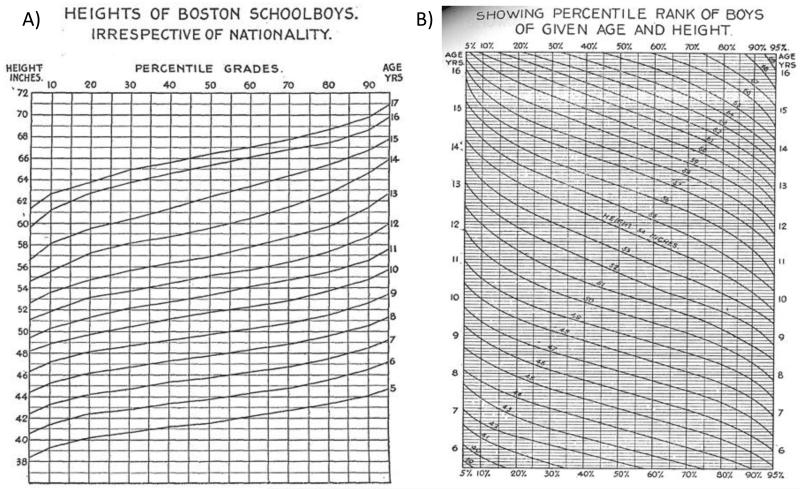
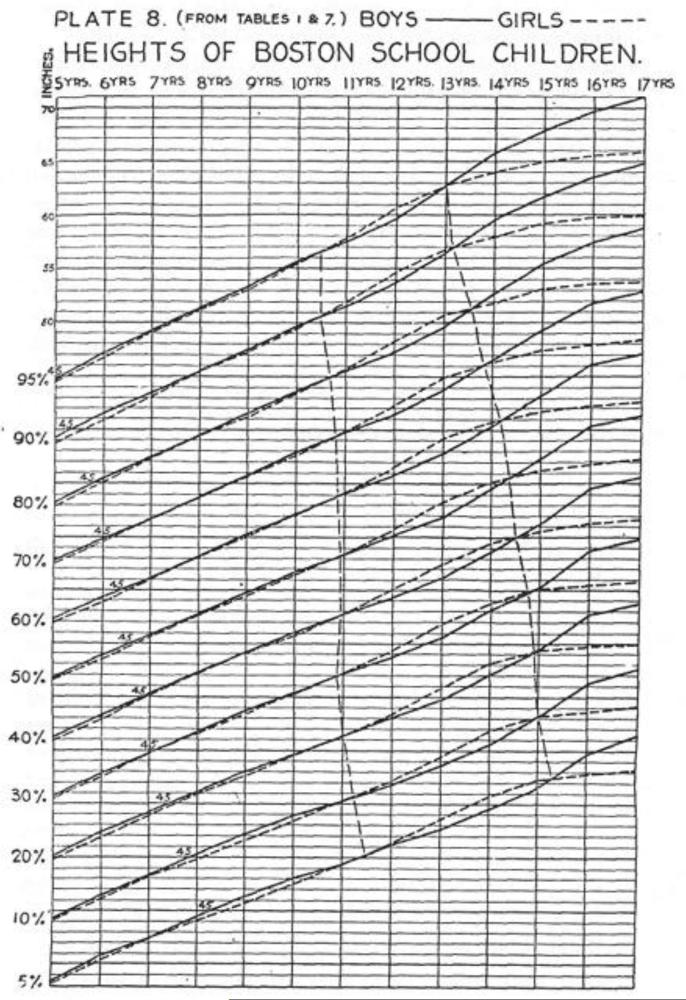
- Bowditch HP. The growth of children studied by Galton’s percentile grades. 22nd annual report of the State Board of Health of Massachusetts. Wright and Potter; Boston: 1891. pp. 479–525.
Publication types
MeSH terms
Grants and funding
LinkOut - more resources
Full Text Sources
Other Literature Sources
Miscellaneous