. 2012 Aug 9;55(15):6832-48.
doi: 10.1021/jm300576q. Epub 2012 Jul 25.

Predicting new indications for approved drugs using a proteochemometric method

Affiliations

Predicting new indications for approved drugs using a proteochemometric method

Sivanesan Dakshanamurthy et al. J Med Chem. .

Abstract

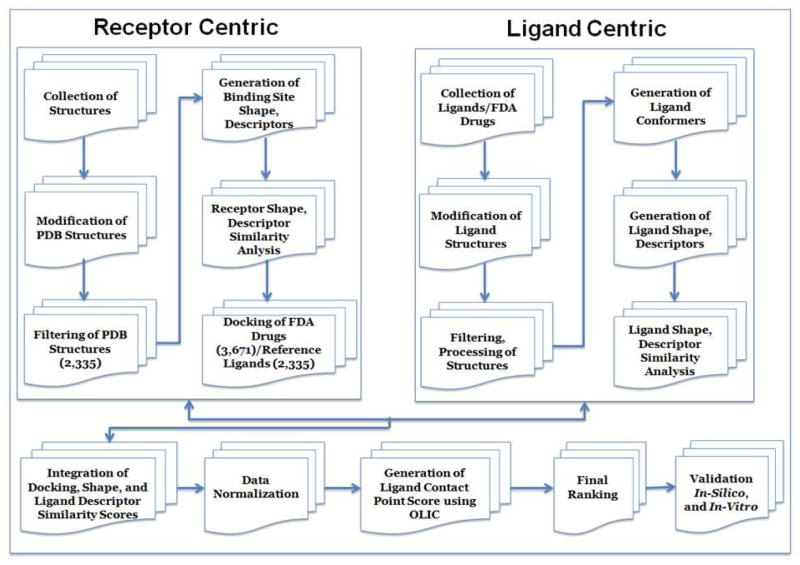
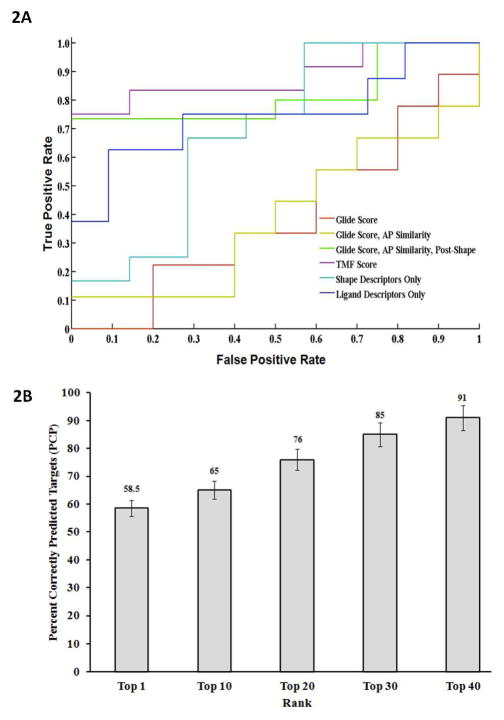
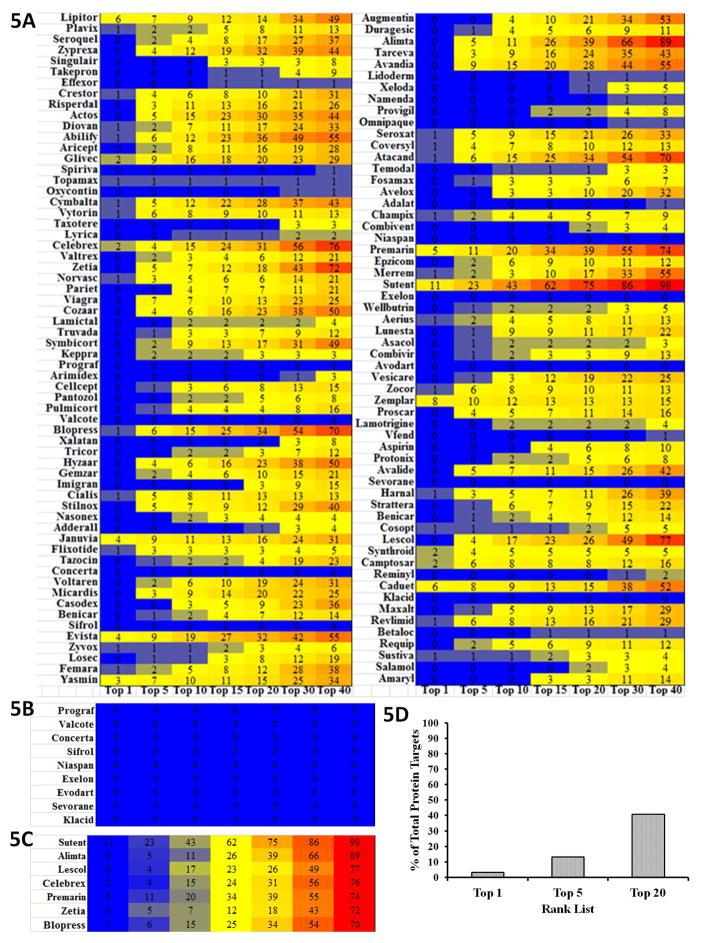
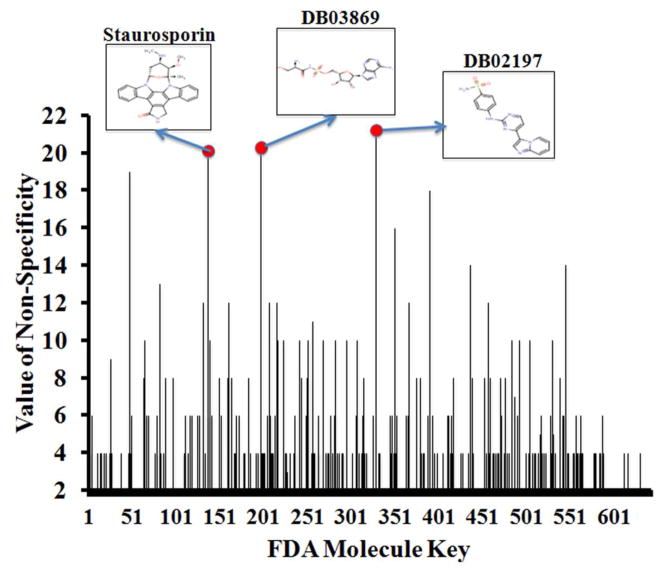
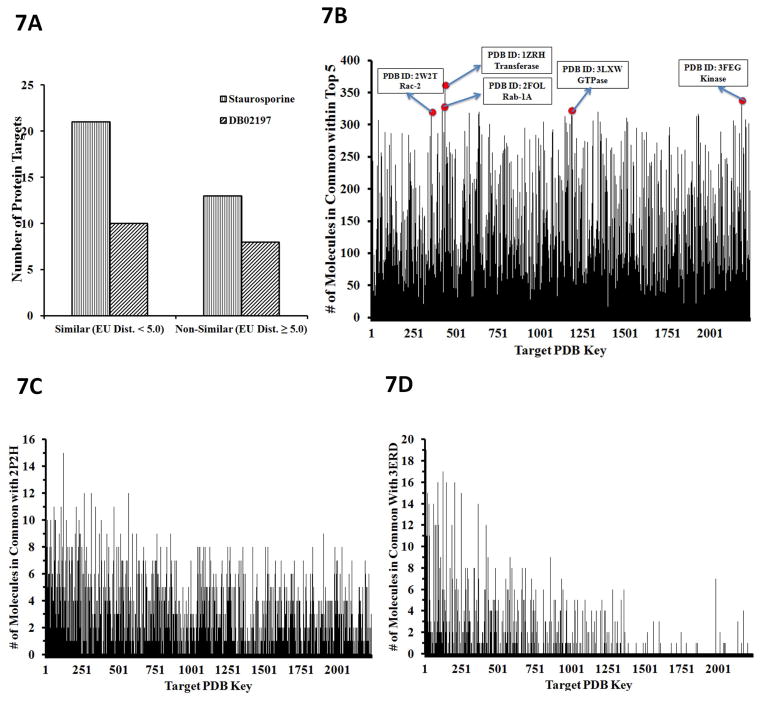
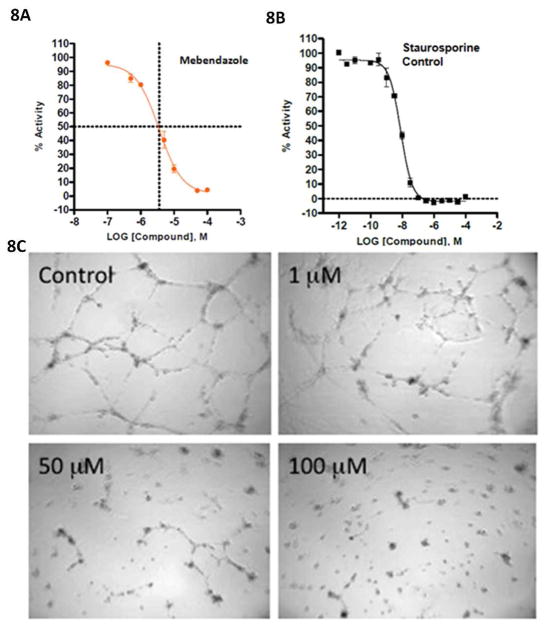
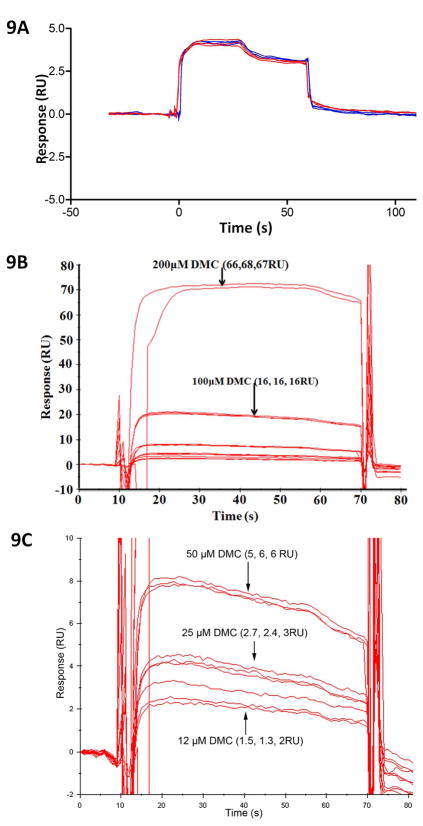
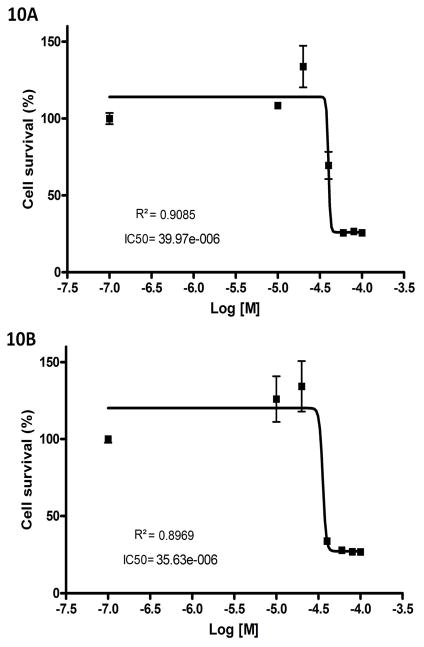
The most effective way to move from target identification to the clinic is to identify already approved drugs with the potential for activating or inhibiting unintended targets (repurposing or repositioning). This is usually achieved by high throughput chemical screening, transcriptome matching, or simple in silico ligand docking. We now describe a novel rapid computational proteochemometric method called "train, match, fit, streamline" (TMFS) to map new drug-target interaction space and predict new uses. The TMFS method combines shape, topology, and chemical signatures, including docking score and functional contact points of the ligand, to predict potential drug-target interactions with remarkable accuracy. Using the TMFS method, we performed extensive molecular fit computations on 3671 FDA approved drugs across 2335 human protein crystal structures. The TMFS method predicts drug-target associations with 91% accuracy for the majority of drugs. Over 58% of the known best ligands for each target were correctly predicted as top ranked, followed by 66%, 76%, 84%, and 91% for agents ranked in the top 10, 20, 30, and 40, respectively, out of all 3671 drugs. Drugs ranked in the top 1-40 that have not been experimentally validated for a particular target now become candidates for repositioning. Furthermore, we used the TMFS method to discover that mebendazole, an antiparasitic with recently discovered and unexpected anticancer properties, has the structural potential to inhibit VEGFR2. We confirmed experimentally that mebendazole inhibits VEGFR2 kinase activity and angiogenesis at doses comparable with its known effects on hookworm. TMFS also predicted, and was confirmed with surface plasmon resonance, that dimethyl celecoxib and the anti-inflammatory agent celecoxib can bind cadherin-11, an adhesion molecule important in rheumatoid arthritis and poor prognosis malignancies for which no targeted therapies exist. We anticipate that expanding our TMFS method to the >27 000 clinically active agents available worldwide across all targets will be most useful in the repositioning of existing drugs for new therapeutic targets.


Figures

Figure 1
Figure 1
Graphical summary of the TMFS method work flow.
Figure 2
Figure 2. (A). Accuracy of the TMFS method represented by ROC curves
We examined the TMFS method accuracy against the Glide docking scoring function. Here we report, in increasing order of enrichment of true bioactive compounds, the performance of each scoring method via their respective AUC: Glide score (0.3889; red), Glide score + atom pair (AP) similarity (0.3889; yellow), shape descriptors only (0.6905; teal), ligand-centric descriptors only (0.7500; blue), Glide score + AP similarity + Post-Shape (0.8167; green), and TMFS score (0.8810; purple). (B). Validation of predicted drug-target associations for FDA approved drugs. Predicted drug-target associations for each FDA drug in the Top 1 through Top 40 ranked hits were individually matched against the publically available experimental binding and functional data. Percent Correctly Predicted (PCP) targets were then calculated using equation 9 for each category of the top rank lists (i.e. Top 1 to Top 40). The histogram (filled bars) represents the Percent Correctly Predicted (PCP) targets (y-axis) for each category of top rank lists. Error bars as well as percentages are highlighted on each histogram bar.
Figure 3
Figure 3. Principle Component Analysis (PCA) of individual protein- and ligand-based descriptor variables for determination of descriptor correlation with obtaining reliable predictions
Scree plot depicting the first three principal components accounting for the majority of the data variance. The first three principle components account for the majority of the data variance, hence the transformed eigenvalue coefficients of the above descriptor variables were plotted against the first three principle components in Supplemental Figure 1.
Figure 4
Figure 4. Analysis of FDA Drug-Target Association
Frequency histogram depicting the number of protein target hits (y-axis) for each FDA drug (x-axis). Targets are considered hits for a particular molecule if the final ranking (Z-score) of the molecule places it in the Top 1 position, or somewhere in the Top 40 positions. (A) Frequency histogram depicting the number of protein targets hit y-aixs for each FDA drugs (x-axis) in the Top 1 position. The 2D structure of staurosporine, the drug with the most hits, is also displayed. (B) Frequency histogram depicting the number of protein target hits (y-axis) for each FDA drug (x-axis) in the Top 40 position. The Top 40 provides a more relaxed criterion for protein targets to be considered as hits. As such, for those molecules that survive the final cut-offs and are found in the Top 40 rank list for a particular protein, we predict that they have a good potential to bind to that given target. DB02197, DB03376 and DB02916, drugs with the most predicted hits, are depicted. (C) To further enrich our prediction paradigm, we included one more term corresponding to ligand shape. The value for this term is the RMSD of the docked ligand compared to the active conformation of the co-crystallized ligand for a particular protein crystal structure, which is derived from a set of 100 protein targets. The histogram portrays the frequency of hits of each FDA drug along with the 2D structure of the drug with most target hits (Indomethacin).
Figure 5
Figure 5. Analysis of FDA Blockbuster Drug-Target Association
(A) Heatmap depicting hit frequencies of the Top 200 “blockbuster” FDA drugs across each top-rank category. Each box shows the number of occurrences while the color scheme illustrates high frequencies as red and low frequencies as blue. (B) Heatmap showing FDA approved drugs predicted to hit the greatest number of protein targets: Sutent, Alimta, Lescol, Celebrex, Premarin, Zetia, and Blopress. (C) Heatmap portraying FDA approved drugs that have no hits in our protein dataset: Prograf, Valcote, Concerta, Sifrol, Niaspan, Exelon, Evodart, Sevorane, and Klacid. (D) Histogram showing the percentage of total protein targets in our data set that have a FDA Blockbuster Drug in their Top 1, 5 and 20 rank lists.
Figure 6
Figure 6. Analysis of Drug Promiscuity
The “value of promiscuity (non-specificity) for each drug is represented as a numerical score from the combined sum of the number of unique folds and the number of unique families that a particular molecule is predicted to hit. The drug with the greatest “value of non-specificity” is considered to be the most promiscuous molecule. The histogram depicts the “values of non-specificity” (y-axis) for each drug (x-axis) that had been ranked in the top 1 position, along with the 2D structures of the three most promiscuous compounds.
Figure 7
Figure 7. Similarly-shaped protein binding pockets bind similar molecules
(A) Histogram where the left-most protein target on the X-axis corresponded to the protein target whose pocket was most similar to the template. If these histograms tapered off to the right, this indicates that protein target ligand commonality is highly correlated to the three-dimensional spatial similarity of their binding pockets. (B) Commonality of the top-ranked drugs. The predicted top 5 ranked drugs were counted for each target. Commonality is defined as the number of times a molecule from the top-rank list for a reference protein target also shows up in the corresponding top-rank list for the rest of the targets. The histogram depicts the “commonality score” for molecules within the Top 5 rank list for each protein target data set. The top 5 protein targets, (w.r.t. commonality score), which were co-crystalized with a nucleotide (4 out of 5 are GDP, one is adenosine), are highlighted with their PDB codes and name. (C) Histogram depicting the number of molecules in common for all protein targets ordered from greatest to least with respect to pocket shape similarity to VEGFR2. (D) Histogram depicting the number of molecules in common for all protein targets ordered from greatest to least with respect to pocket shape similarity to ERa.
Figure 8
Figure 8. Mebendazole binds directly to VEGFR2 kinase assay and also inhibits angiogenesis
(A) Mebendazole binds directly to VEGFR2 and affects VEGFR2 kinase activity with an IC50 value of 3.6 μM. IC50 curves were generated using GraphPad 5 and a standard 4-parameter non-linear regression model (log [inhibitor] vs response – variable slope). Data points correspond to the averages of duplicate wells, and error bars represent the mean ± replicate % activity. The graphical representation shows dashed lines at the IC50 values, where the vertical line is at (log x) = −5.4437. Solving the equation (log x) = −5.4437 results in the IC50 value of 3.6 μM. (B) Control: Staurosporine binds to VEGFR2 and affects kinase activity with a IC50 value of 8 nM. (C). Mebendazole, predicted to act as a VEGFR2 inhibitor by TMFS, inhibits angiogenesis in a HUVEC cell based assay. Mebendazole significantly inhibited network formation with an IC50 value of 8.8 μM, which is implicated by the lack of cellular migration, alignment and branching.
Figure 9
Figure 9. Celecoxib (CCB) and Dimethyl-celecoxib (DMC) bind directly to immobilized cadherin-11 (CDH11) in Surface Plasmon Resonance (SPR) assay
(A) CCB and DMC bind to recombinant mouse extracellular domain (EC) 1–2 of CDH11 protein immobilized on the surface of the chip via similar patterns, as evident in the sensogram. CCB and DMC were separately injected three times on the CM5 chip at 25 μM. (B & C) CCB and DMC bind in a dose-dependent manner. (B) Lower magnification of the sensogram showing the signals generated from 200 and 100 μM of DMC bound to cadherin-11. (C) Higher magnification of the compacted signals from panel A showing the binding levels of 50, 25 and 12 μM DMC to cadherin-11. Assays were performed in triplicates for each DMC concentration.
Figure 10
Figure 10. Growth inhibition of MDA-MB-231 invasive breast cancer cell line by celecoxib (CCB) and its COX-2 inactive analogue dimethyl –celecoxib (DMC)
MTS assays demonstrating concentration-dependent cell growth inhibition when MDA-MB-231 cells were exposed to increasing doses of CCB or DMC for 48 hrs. Data is presented as the mean ± S.E.M. (A) CCB causes inhibition with an IC50 of 40 μM, and (B) DMC causes inhibition with an IC50 36 μM.

References

    1. Paul SM, Mytelka DS, Dunwiddie CT, Persinger CC, Munos BH, Lindborg SR, Schacht AL. How to improve R&D productivity: The pharmaceutical industry’s grand challenge. Nat Rev Drug Discovery. 2010;9:203–214. - PubMed
    1. Lawrence S. Drug output slows in 2006. Nat Biotechnol. 2007;25:1073.
    1. Huang R, Southall N, Wang Y, Yasgar A, Shinn P, Jadhav A, Nguyen D, Austin C. The NCGC Pharmaceutical Collection: A Comprehensive Resource of Clinically Approved Drugs Enabling Repurposing and Chemical Genomics. Sci Transl Med. 2011;3(80):80ps16. - PMC - PubMed
    1. Collins FS. Mining for therapeutic gold. Nat Rev Drug Discovery. 2011;10(6):395. - PMC - PubMed
    1. DiMasi JA, Hansen RW, Grabowski HG. The price of innovation: new estimates of drug development costs. J Health Econ. 2003;22(2):151–185. - PubMed

Publication types

MeSH terms