. 2012 Aug 7;107(4):739-47.
doi: 10.1038/bjc.2012.301. Epub 2012 Jul 10.

Lipoprotein lipase is frequently overexpressed or translocated in cervical squamous cell carcinoma and promotes invasiveness through the non-catalytic C terminus

Affiliations

Lipoprotein lipase is frequently overexpressed or translocated in cervical squamous cell carcinoma and promotes invasiveness through the non-catalytic C terminus

S A Carter et al. Br J Cancer. .

Abstract

Background: We studied the biological significance of genes involved in a novel t(8;12)(p21.3;p13.31) reciprocal translocation identified in cervical squamous cell carcinoma (SCC) cells.

Methods: The rearranged genes were identified by breakpoint mapping, long-range PCR and sequencing. We investigated gene expression in vivo using reverse-transcription PCR and tissue microarrays, and studied the phenotypic consequences of forced gene overexpression.

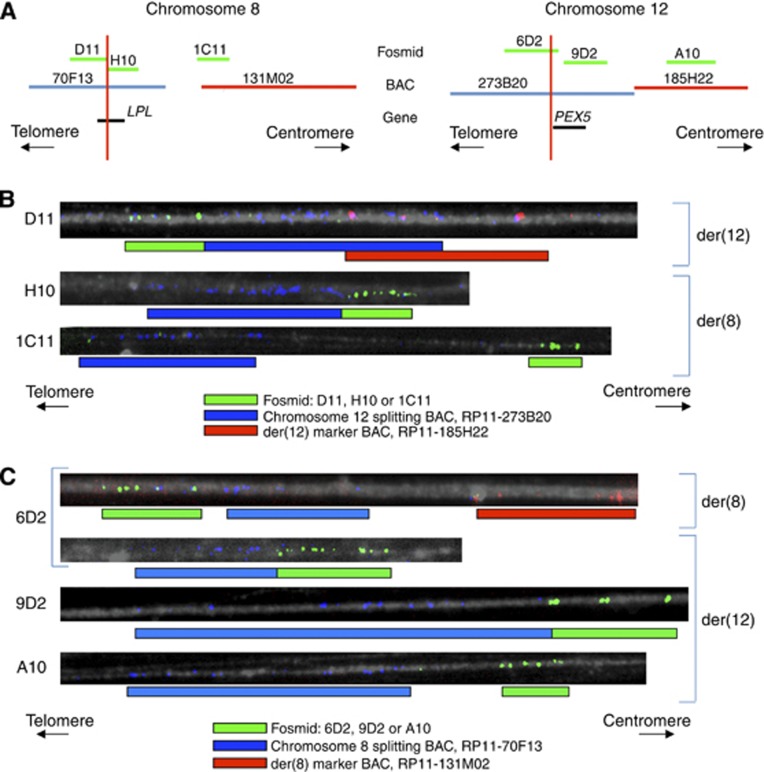
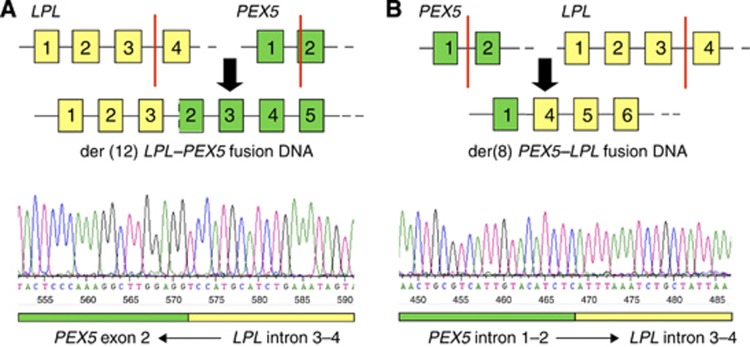
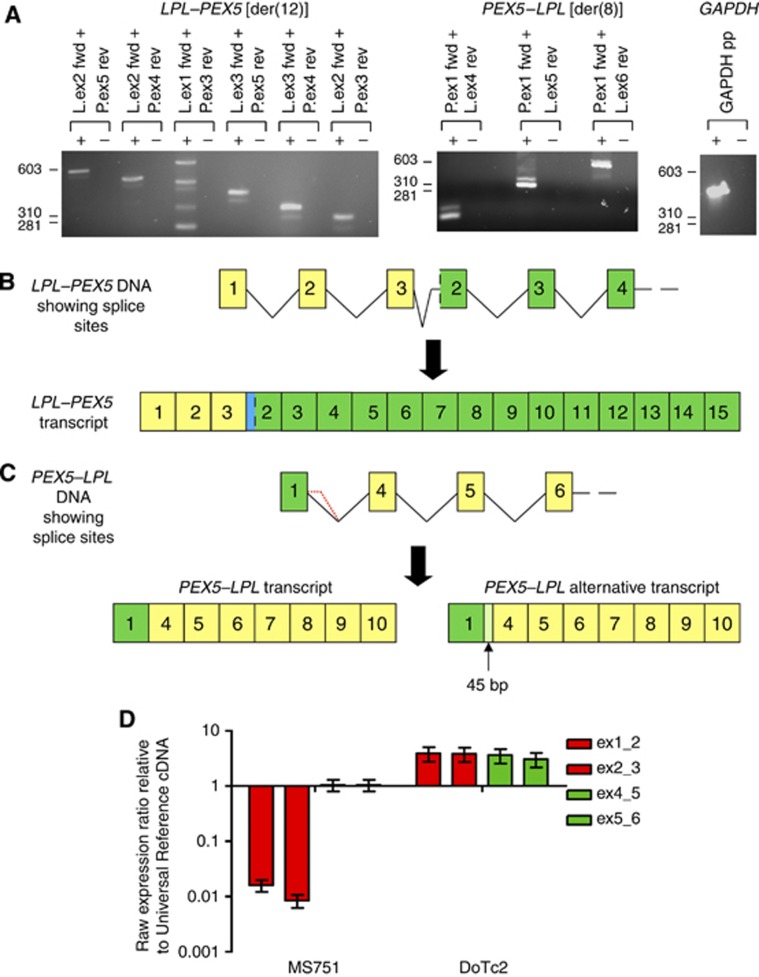
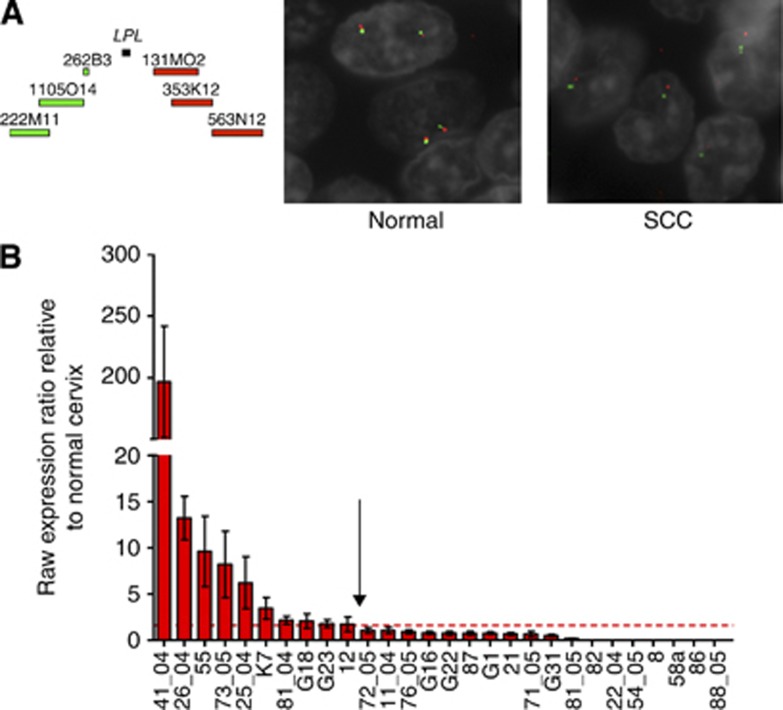
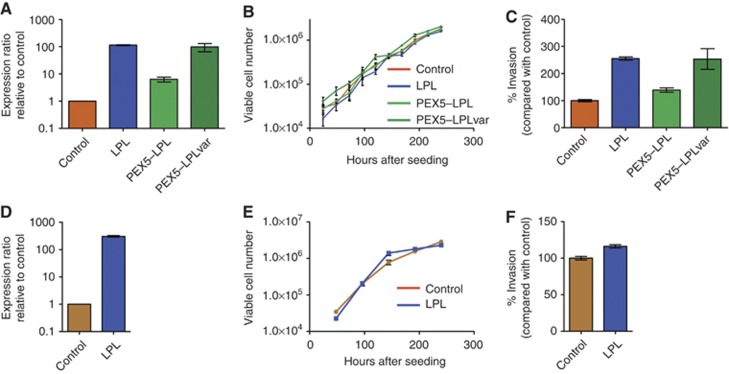
Results: The rearrangement involved lipoprotein lipase (LPL) and peroxisome biogenesis factor-5 (PEX5). Whereas LPL-PEX5 was expressed at low levels and contained a premature stop codon, PEX5-LPL was highly expressed and encoded a full-length chimeric protein (including the majority of the LPL coding region). Consistent with these findings, PEX5 was constitutively expressed in normal cervical squamous cells, whereas LPL expression was negligible. The LPL gene was rearranged in 1 out of 151 cervical SCCs, whereas wild-type LPL overexpression was common, being detected in 10 out of 28 tissue samples and 4 out of 10 cell lines. Forced overexpression of wild-type LPL and PEX5-LPL fusion transcripts resulted in increased invasiveness in cervical SCC cells, attributable to the C-terminal non-catalytic domain of LPL, which was retained in the fusion transcripts.

Conclusion: This is the first demonstration of an expressed fusion gene in cervical SCC. Overexpressed wild-type or translocated LPL is a candidate for targeted therapy.


Conflict of interest statement

The authors declare no conflict of interest.

Figures

Figure 1
Figure 1
Breakpoint mapping by metaphase BAC FISH. The panels show hybridisation to der(8) and der(12) in MS751 metaphase spreads of BAC probes (labelled blue or green) that mapped to the selected 1-Mb regions on 8p21.3 (A) and 12p13.31 (B). For each probe, the reciprocal chromosome in the translocation (i.e., chromosome 12 in (A) and chromosome 8 in (B)) was labelled in red. Where a BAC did not hybridise to a derivative chromosome, the image is not shown. The BACs that hybridised to both der(8) and der(12) (i.e., ‘splitting’ BACs) were the chromosome 8 BAC RP11-70F13 (A) and the chromosome 12 BACs RP11-273B20 and RP11-653C9 (B).
Figure 2
Figure 2
Breakpoint mapping by fosmid fibre FISH. (A) The fosmid probes (labelled green) selected for hybridisation to MS751 chromosome fibres either tiled the genes of interest on chromosome 8 and 12 (LPL and PEX5) or were located centromeric to the breakpoint region, and therefore acted as a control. The fosmids were co-hybridised with BAC probes that mapped to the breakpoint of the reciprocal chromosome (labelled blue) or centromeric to it (labelled red). (B) Of the chromosome 8 fosmids, D11 hybridised to der(12) (co-localisation of green signals with both blue and red signals), whereas H10 and 1C11 hybridised to der(8) (co-localisation of green signals with only blue signals). (C) Of the chromosome 12 fosmids, 6D2 split between der(8) and der(12) (co-localisation of green signals with both blue and red signals on some fibres, and with blue signals alone on other fibres), whereas 9D2 and A10 hybridised to der(12) (co-localisation of green signals with only blue signals). The suspected breakpoint regions on each chromosome determined by fosmid fibre FISH are shown in panel (A) (red vertical lines).
Figure 3
Figure 3
Schematic of breakpoints resulting in LPL-PEX5 and PEX5-LPL fusion genes. Numbered boxes represent exons of LPL (yellow) and PEX5 (green), with red vertical lines indicating the positions of the breakpoints resulting in the LPL-PEX5 (A) and PEX5-LPL (B) fusion genes. The lower panels show the sequencing traces for each breakpoint; a reverse read in (A) and a forward read in (B).
Figure 4
Figure 4
Identification of LPL–PEX5 and PEX5–LPL transcripts in MS751. (A) MS751 mRNA was reverse transcribed (in the presence (+) or absence (−) of reverse transcriptase), and the cDNA amplified using primer pairs specific to exons of LPL (L) or PEX5 (P). The combinations selected were specific for LPL–PEX5 (left panel), PEX5–LPL (middle panel) or GAPDH (right panel). All primer combinations gave products, indicating that all transcripts were present in MS751 cDNA. (B) Sequencing PCR products showed that the LPL–PEX5 transcript was composed of the first 3 exons of LPL, followed by intronic sequence of intron 3–4 of LPL and then exon 2 of PEX5 without the first base, through to coding exon 15 of PEX5. (C) The most common PEX5–LPL transcript was composed of the first exon of PEX5, followed by exons 4–10 of LPL. Alternative splicing extended PEX5 exon 1 into PEX5 intron 1–2. (D) Quantitative RT–PCR was used to measure expression of LPL exons upstream and downstream of the MS751 translocation breakpoint. Ratios were referenced to Universal Reference cDNA, which was generated from a mixture of cells, including those with high LPL expression. Levels of upstream exons (boundaries of exons 1/2 and 2/3 (ex1_2 and ex3_4, respectively)) are in red, whereas downstream exons (boundaries of exon 4/5 and 5/6 (ex4_5 and ex5_6, respectively)) are in green. Error bars indicate the s.e.m., using four different housekeeping genes for normalisation. In MS751, downstream exons were expressed at approximately 100-fold greater abundance than upstream exons. In contrast, in the cervical SCC cell line DoTc2, which overexpressed wild-type LPL, there was no difference in levels of expression of upstream and downstream exons.
Figure 5
Figure 5
LPL status in cervical SCC. (A) For TMA FISH, the probes were three tiling BACs 5′ of LPL and three tiling BACs 3′ of LPL, which were labelled in green and red, respectively (left panel). The DNA counterstain (4′,6-diamidino-2-phenylindole) is shown in grey. Co-localisation of probes was seen in normal cervix samples (middle panel) and 150/151 primary cervical SCC samples. One cervical SCC sample showed probe separation (right panel), indicating rearrangement of the LPL gene. Interestingly, this case also showed deletion of the wild-type LPL allele. (B) Quantitative RT–PCR to measure levels of full-length LPL was performed on 28 cervical SCC samples and 5 normal cervical squamous epithelium samples, relative to Universal Reference cDNA. Error bars indicate the s.e.m. for LPL expression levels, normalised to four different housekeeping genes. The dashed line shows 3 standard deviations above the mean of the five normal samples. Ten tissue samples (left of arrow) showed a significantly higher level of LPL expression than normal cervix.
Figure 6
Figure 6
Phenotypic consequences of overexpression of wild-type LPL or LPL fusion proteins in cervical SCC cells. The top row (AC) shows the effects of overexpressing wild-type LPL and the PEX5–LPL fusion proteins in SW756 cells, whereas the bottom row (DF) shows the effects of overexpressing wild-type LPL in C33A cells. (A, D) Expression levels were determined by qRT–PCR, using primers for the C terminus of LPL, which was present in all transgenes. (B, E) Growth curves were generated for stable populations of cells expressing PEX5–LPL, PEX5–LPLvar or LPL, compared with those transfected with empty vector. Error bars indicate the s.e.m. between triplicate wells. There were no significant differences in growth. (C, F) Invasion through basement membrane extract was measured and expressed as the percentage of invading cells relative to control. Error bars indicate the s.e.m. between triplicate assays. Wild-type LPL and the fusion proteins consistently increased the invasiveness of cervical SCC cells.

References

    1. Arends MJ, Buckley CH, Wells M (1998) Aetiology, pathogenesis, and pathology of cervical neoplasia. J Clin Pathol 51(2): 96–103 - PMC - PubMed
    1. Baldwin P, Laskey R, Coleman N (2003) Translational approaches to improving cervical screening. Nat Rev Cancer 3(3): 217–226 - PubMed
    1. Ben-Zeev O, Stahnke G, Liu G, Davis RC, Doolittle MH (1994) Lipoprotein lipase and hepatic lipase: the role of asparagine-linked glycosylation in the expression of a functional enzyme. J Lipid Res 35(9): 1511–1523 - PubMed
    1. Blanchette-Mackie EJ, Masuno H, Dwyer NK, Olivecrona T, Scow RO (1989) Lipoprotein lipase in myocytes and capillary endothelium of heart: immunocytochemical study. Am J Physiol 256(6 Part 1): E818–E828 - PubMed
    1. Bosch FX, Manos MM, Munoz N, Sherman M, Jansen AM, Peto J, Schiffman MH, Moreno V, Kurman R, Shah KV (1995) Prevalence of human papillomavirus in cervical cancer: a worldwide perspective. International biological study on cervical cancer (IBSCC) Study Group. J Natl Cancer Inst 87(11): 796–802 - PubMed

Publication types