. 2012 Sep 7;287(37):31494-502.
doi: 10.1074/jbc.M112.386300. Epub 2012 Jul 10.

Deciphering the role of CD1e protein in mycobacterial phosphatidyl-myo-inositol mannosides (PIM) processing for presentation by CD1b to T lymphocytes

Affiliations

Deciphering the role of CD1e protein in mycobacterial phosphatidyl-myo-inositol mannosides (PIM) processing for presentation by CD1b to T lymphocytes

Diane Cala-De Paepe et al. J Biol Chem. .

Abstract

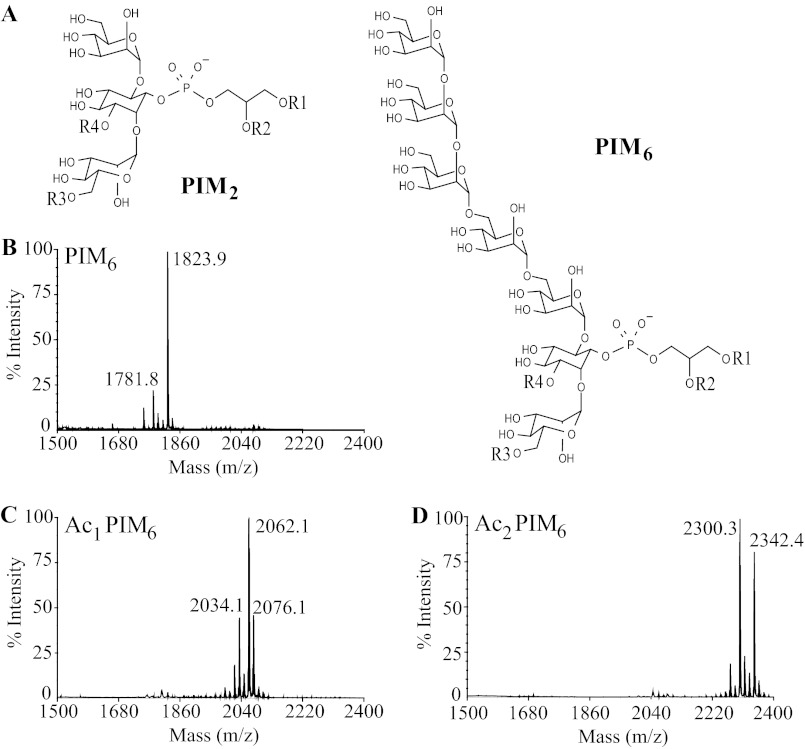
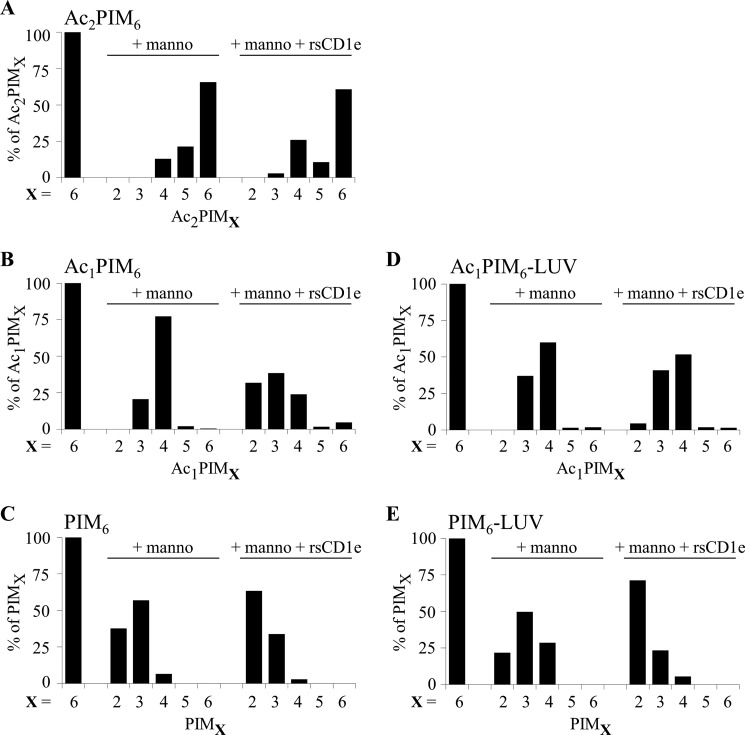
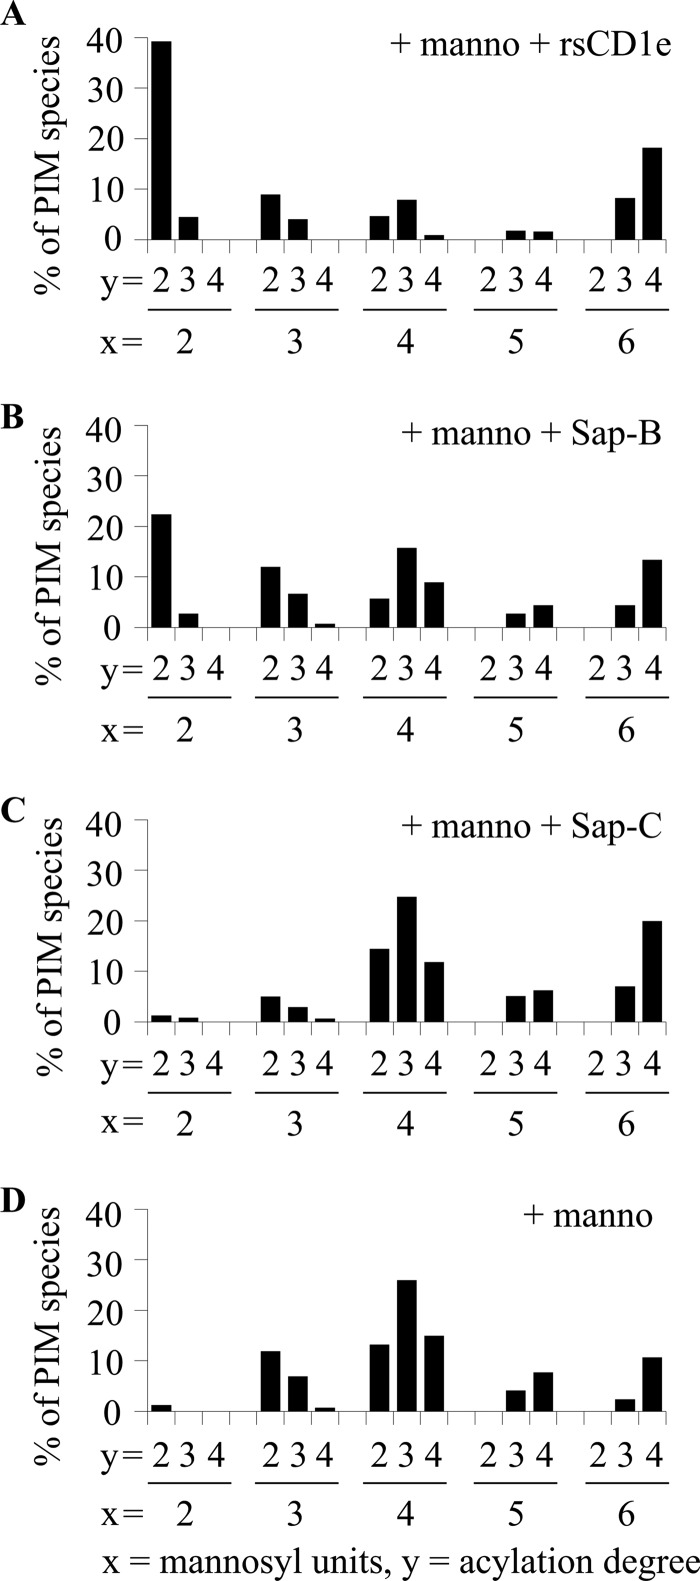
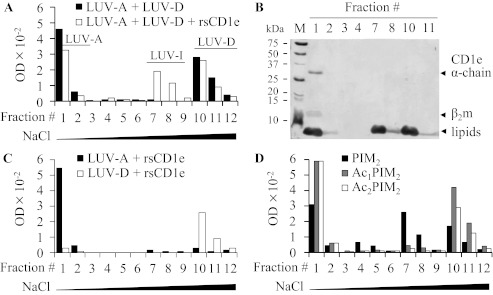
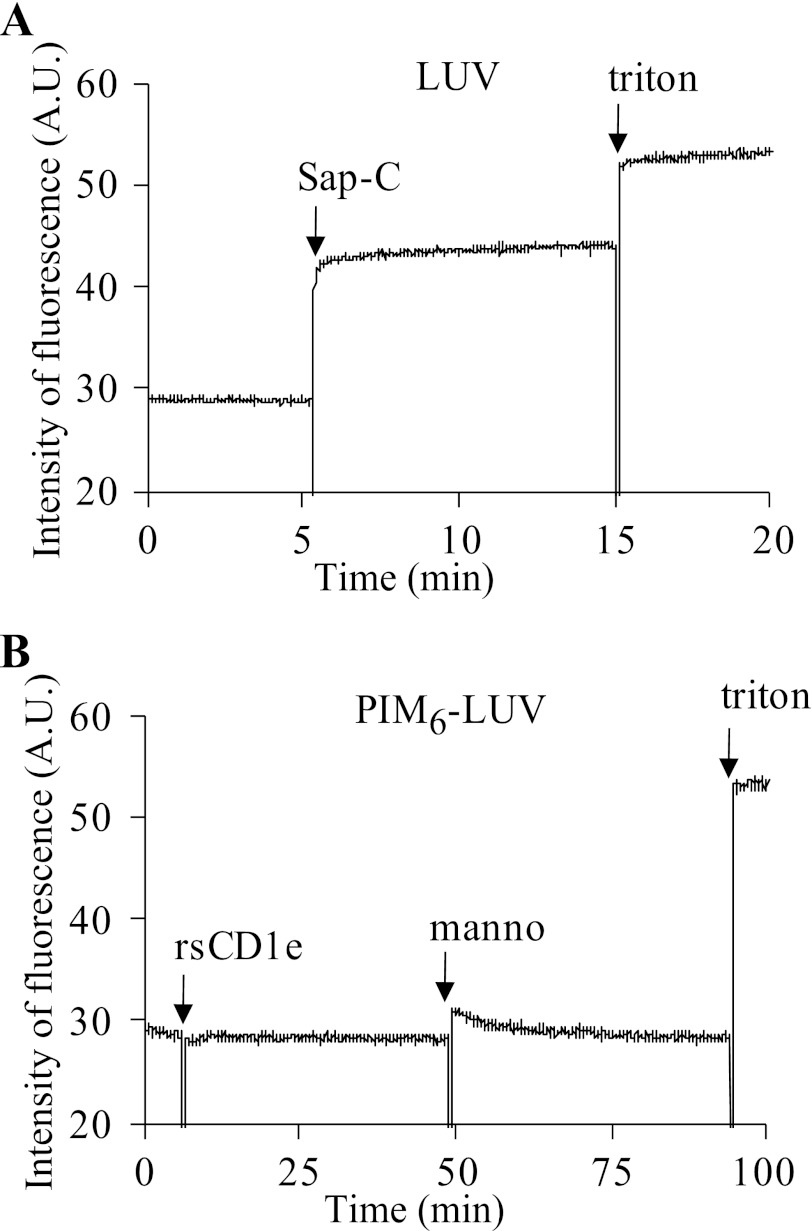
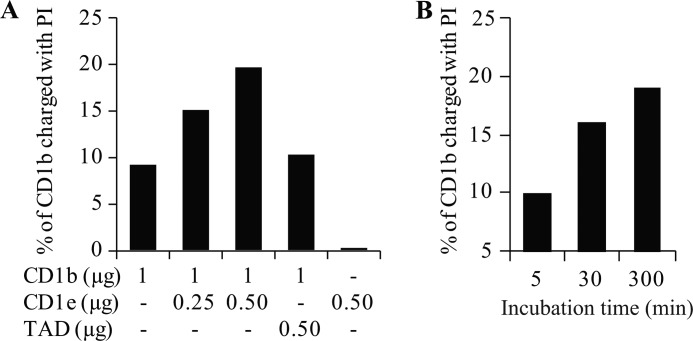
Lipids are important antigens that induce T cell-mediated specific immune responses. They are presented to T lymphocytes by a specific class of MHC-I like proteins, termed CD1. The majority of the described CD1-presented mycobacterial antigens are presented by the CD1b isoform. We previously demonstrated that the stimulation of CD1b-restricted T cells by the hexamannosylated phosphatidyl-myo-inositol (PIM(6)), a family of mycobacterial antigens, requires a prior partial digestion of the antigen oligomannoside moiety by α-mannosidase and that CD1e is an accessory protein absolutely required for the generation of the lipid immunogenic form. Here, we show that CD1e behaves as a lipid transfer protein influencing lipid immunoediting and membrane transfer of PIM lipids. CD1e selectively assists the α-mannosidase-dependent digestion of PIM(6) species according to their degree of acylation. Moreover, CD1e transfers only diacylated PIM from donor to acceptor liposomes and also from membranes to CD1b. This study provides new insight into the molecular mechanisms by which CD1e contributes to lipid immunoediting and CD1-restricted presentation to T cells.


Figures

FIGURE 1.
FIGURE 1.
Structure of PIM2 and PIM6 subfamilies (A) and MALDI-TOF MS spectra in negative-ion mode of purified PIM6 (B), Ac1PIM6 (C), and Ac2PIM6 (D) acyl forms. In monoacylated PIM (lyso-PIM), R1 represents acyl group; R2–R4 represents H. In diacylated PIM (PIM), R1 and R2 represent acyl group; R3 and R4 indicate H. In triacylated PIM (Ac1PIM), R1, R2, R3 indicate acyl group; R4 indicates H. In tetraacylated PIM (Ac2PIM), R1 to R4 indicates acyl group.
FIGURE 2.
FIGURE 2.
PIM6 acylation degree determines their glycosidic processing. The different purified PIM6 acyl forms, Ac2PIM6 (A), Ac1PIM6 (B and D) and PIM6 (C and E), were digested by α-mannosidase in the absence (+manno) or in presence (+manno +rsCD1e) of rsCD1e. The relative abundance of the different PIM species generated (PIMX, where X indicates the number of mannosyl units) was determined by negative-ion mode MALDI-TOF MS analysis of the reaction mixture (mass spectra are shown in supplemental Fig. 1). Ac1PIM6 and PIM6 were either sonicated (B and C) or inserted in liposomes (D and E). The results presented here are from one representative experiment of three recorded spectra.
FIGURE 3.
FIGURE 3.
rsCD1e and Sap-B but not Sap-C promote in vitro α-mannosidase digestion of purified mixPIM6. Relative abundance of the different glycoforms deduced from the negative-ion mode MALDI-TOF MS analysis of Ac2PIM6 after hydrolysis by α-mannosidase in the presence of rsCD1e (A), Sap-B (B), Sap-C (C), or in the absence of any protein (D). x and y indicate mannosyl unit and fatty acid numbers in PIM species, respectively. The results presented here are from one representative experiment of three recorded spectra.
FIGURE 4.
FIGURE 4.
rsCD1e transfers diacylated PIM2. A, LUV-A (1 μmol of total lipids) and POPS-containing LUV-D (1 μmol of total lipids) were incubated with (open squares) or without (black filled squares) rsCD1e (2.1 nmol), and final liposomes populations were separated on DEAE chromatography using increasing concentrations of NaCl (fractions 1–3, no NaCl; 4–6, 12.5 mm NaCl; 7–9, 60 mm NaCl; 10–12, 1 m NaCl) and monitored by turbidity measurement at 600 nm of the collected fractions. B, SDS-PAGE analysis of DEAE fractions obtained in A in the presence of rsCD1e. Both proteins and lipids are stained. rsCD1e was eluted in F1 and lipids were present in F1, F2, F7, F8, F10, and F11. C, DEAE chromatography of LUV-A (black filled squares) or LUV-D (open squares) incubated separately with rsCD1e. Fractions 1–12 were eluted using NaCl concentrations as described in A. D, LUV-A and LUV-D containing Ac2PIM2 (open squares), Ac1PIM2 (gray filled squares) or PIM2 (black filled squares) were incubated with rsCD1e and separated on DEAE chromatography as described in A. One representative experiment of three independent ones is shown in A to D.
FIGURE 5.
FIGURE 5.
rsCD1e does not alter model membrane integrity. LUV were loaded with 20 mm of calcein, and calcein release was measured by recording induced fluorescence at 517 nm. A, calcein release from LUV composed of POPC/cholesterol/POPS, 65/25/10 (40 nmol of total lipids) in the presence of Sap-C (0.5 nmol) at pH 4.7. B, calcein release from LUV composed of POPC/cholesterol/POPS/PIM6, 65/25/10/4 (40 nmol of total lipids) in the presence of rsCD1e (2.1 nmol), with or without α-mannosidase (manno; 0.44 unit) at pH 4.7. The maximum fluorescence, indicating complete liposome disruption, was observed after addition of 10 μl of Triton X-100 (triton; 10%). A.U., arbitrary units.
FIGURE 6.
FIGURE 6.
rsCD1e promotes loading of liposome-inserted phosphatidyl-inositol onto rsCD1b. A- [3H]-PI-containing liposomes (LUV-[3H]-PI; 3.6 nmol total lipids) were incubated for 5 h with rsCD1b (1 μg; 19.6 pmol) and with or without rsCD1e (0.25 or 0.5 μg; 6.6 and 13.2 pmol, respectively). rsCD1b and rsCD1e were separated on isoelectric focusing gel, and radioactivity associated to rsCD1b was determined. LUV-[3H]-PI were incubated with rsCD1b and 0.5 μg of N Oct-3 transactivation domain (TAD) as control. One of three independent experiments is shown. B, LUV-[3H]-PI were incubated with rsCD1b and rsCD1e (0.5 μg) during different periods of time and rsCD1b-associated radioactivity was measured as described in A.

References

    1. Barral D. C., Brenner M. B. (2007) CD1 antigen presentation: How it works. Nat. Rev. Immunol. 7, 929–941 - PubMed
    1. De Libero G., Collmann A., Mori L. (2009) The cellular and biochemical rules of lipid antigen presentation. Eur. J. Immunol. 39, 2648–2656 - PubMed
    1. Dougan S. K., Kaser A., Blumberg R. S. (2007) CD1 expression on antigen-presenting cells. Curr. Top Microbiol. Immunol. 314, 113–141 - PubMed
    1. Sugita M., Grant E. P., van Donselaar E., Hsu V. W., Rogers R. A., Peters P. J., Brenner M. B. (1999) Separate pathways for antigen presentation by CD1 molecules. Immunity 11, 743–752 - PubMed
    1. Angenieux C., Salamero J., Fricker D., Cazenave J. P., Goud B., Hanau D., de La Salle H. (2000) Characterization of CD1e, a third type of CD1 molecule expressed in dendritic cells. J. Biol. Chem. 275, 37757–37764 - PubMed

Publication types

MeSH terms