. 2012 Sep;92(3):611-20.
doi: 10.1189/jlb.0112050. Epub 2012 Jul 10.

Induction of Bcl-3 by acute binge alcohol results in toll-like receptor 4/LPS tolerance

Affiliations

Induction of Bcl-3 by acute binge alcohol results in toll-like receptor 4/LPS tolerance

Shashi Bala et al. J Leukoc Biol. 2012 Sep.

Abstract

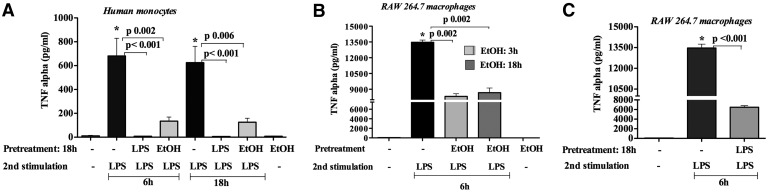
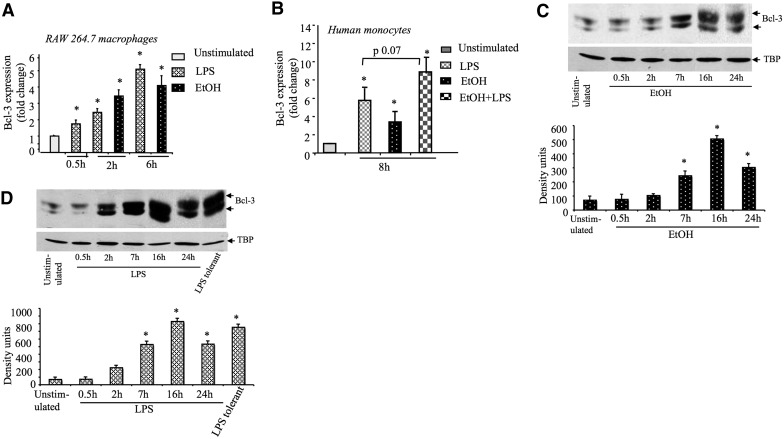
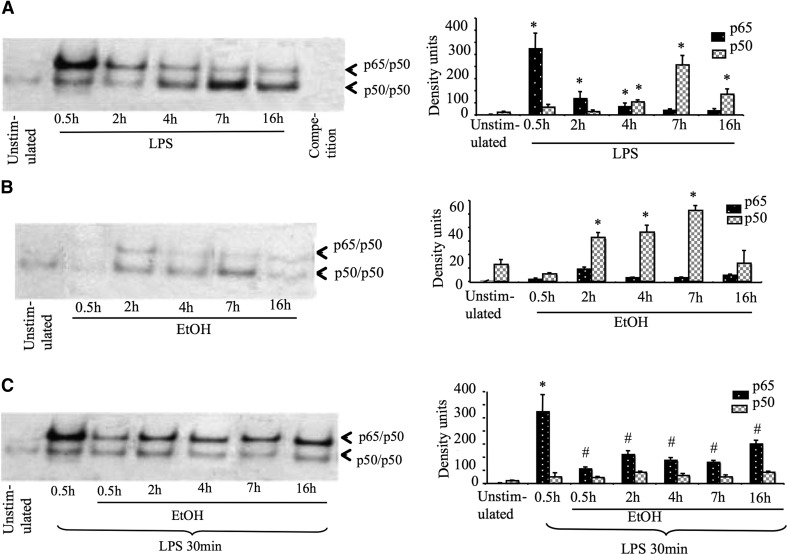
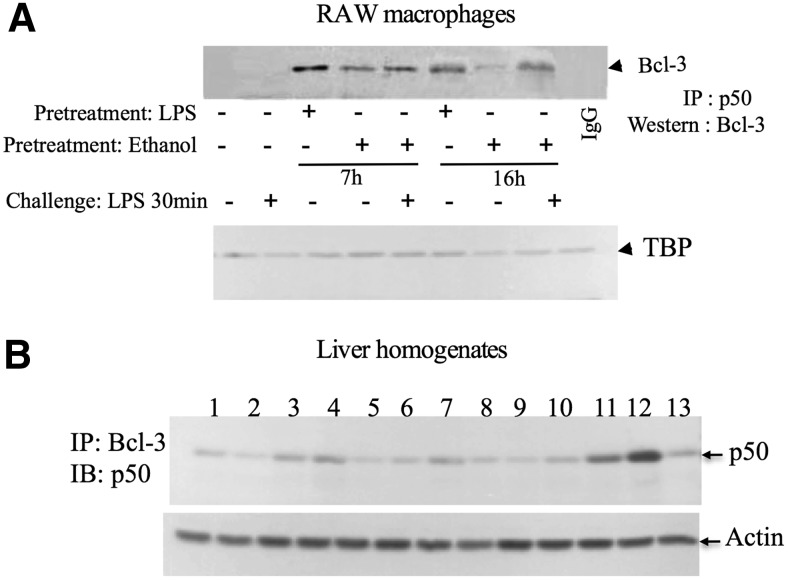
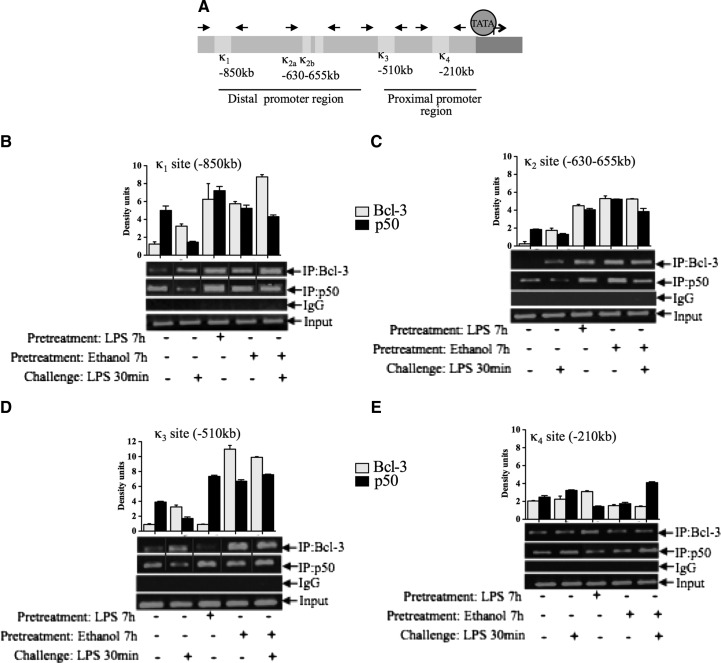
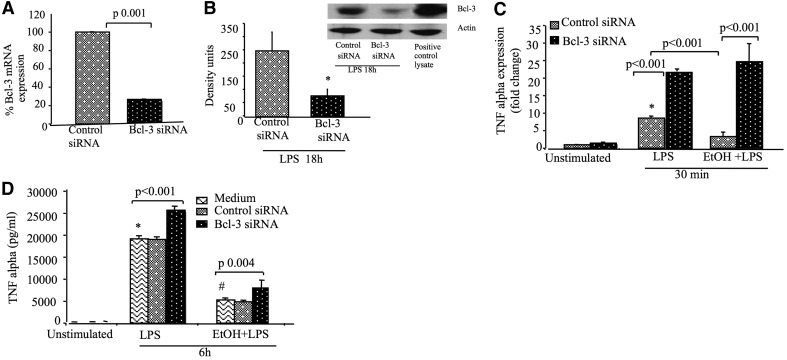
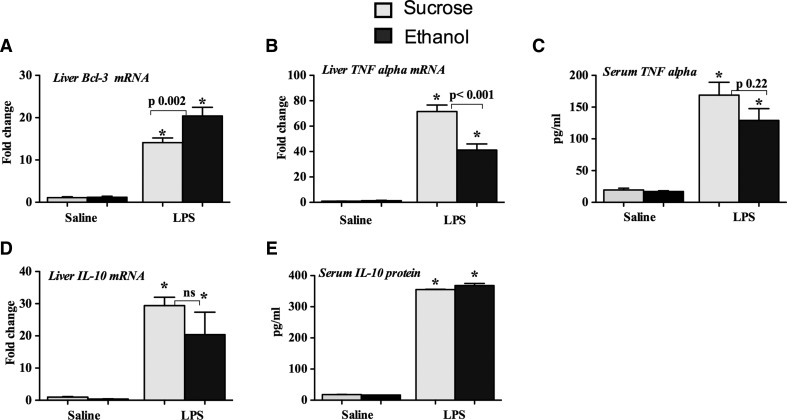
Acute alcohol binge results in immunosuppression and impaired production of proinflammatory cytokines, including TNF-α. TNF-α production is induced by LPS, a TLR4 ligand, and is tightly regulated at various levels of the signaling cascade, including the NF-κB transcription factor. Here, we hypothesized that acute alcohol induces TLR4/LPS tolerance via Bcl-3, a nuclear protein and member of the NF-κB family. We found that acute alcohol pretreatment resulted in the same attenuating effect as LPS pretreatment on TLR4-induced TNF-α production in human monocytes and murine RAW 264.7 macrophages. Acute alcohol-induced Bcl-3 expression and IP studies revealed increased association of Bcl-3 with NF-κB p50 homodimers in alcohol-treated macrophages and in mice. ChIP assays revealed increased occupancy of Bcl-3 and p50 at the promoter region of TNF-α in alcohol-pretreated cells. To confirm that the Bcl-3-p50 complex regulates transcription/production of TNF-α during acute alcohol exposure, we inhibited Bcl-3 expression using a targeted siRNA. Bcl-3 knockdown prevented the alcohol-induced inhibition of TNF-α mRNA and protein production. In a mouse model of binge alcohol, an increase in Bcl-3 and a concomitant decrease in TNF-α but no change in IL-10 production were found in mice that received alcohol followed by LPS challenge. In summary, our novel data suggest that acute alcohol treatment in vitro and in vivo induces molecular signatures of TLR4/LPS tolerance through the induction of Bcl-3, a negative regulator of TNF-α transcription via its association with NF-κB p50/p50 dimers.


Figures

Figure 1.
Figure 1.. Acute alcohol induces TLR4/LPS tolerance in monocytes/macrophages.
(A) Human monocytes (n=4) were pretreated with 25 mM ethanol (EtOH) or 100 ng/ml LPS for 18 h, cells were washed two times with PBS, and fresh medium was added and restimulated with 100 ng/ml LPS for 6 or 18 h. (B) Murine RAW 264.7 macrophages were pretreated with 50 mM ethanol for 3 or 18 h or (C) 100 ng/ml LPS for 18 h, cells were washed two times with PBS, and fresh medium was added and restimulated with 100 ng/ml LPS for 6 h. Cell-free supernatants were collected and analyzed for TNF-α levels by ELISA. Data represent the mean value (sd as error bars) of four independent experiments (*P<0.05 compared with unstimulated cells). ANOVA was used for statistical analysis.
Figure 2.
Figure 2.. Acute alcohol induces Bcl-3 expression.
(A) RAW 264.7 macrophages or (B) human monocytes (n=4) were stimulated with 100 ng/ml LPS or 25 mM (monocytes) or 50 mM (RAW 264.7 cells) ethanol or their combination (EtOH+LPS), and total RNA was extracted and analyzed for Bcl-3 mRNA expression by real-time PCR. Data were normalized to 18S and represent the mean value (sd as error bars) of at least three independent experiments (*P<0.05 vs. unstimulated cells). (C and D) RAW 264.7 macrophages were stimulated with 50 mM ethanol or 100 ng/ml LPS for indicated times, nuclear proteins were extracted and subjected to Western blot analysis with anti-Bcl-3 or loading control antibody [tata-binding protein (TBP)]. To induce LPS tolerance, cells were pretreated with 100 ng/ml LPS for 18 h, washed with PBS two times, and restimulated with LPS for 2 h. The mean density units (sd as error bars in the bar graph) from three experiments are shown (*P<0.05 vs. unstimulated cells). ANOVA (B) or nonparametric Mann Whitney test (A,C–D) was used for statistical analysis.
Figure 3.
Figure 3.. Acute alcohol down-regulates LPS-induced p65 subunits of NF-κB.
RAW 264.7 macrophages were stimulated with (A) 100 ng/ml LPS or (B) 50 mM ethanol or (C) pretreated with alcohol and then challenged with LPS for 30 min. Equal amount of nuclear proteins were subjected to EMSA. On the left, the mean density units (sd as error bars in the bar graph) from three experiments are shown (*P<0.05 vs. unstimulated cells; #P<0.05 compared with LPS alone-treated cells). Nonparametric Mann Whitney test was used for statistical analysis.
Figure 4.
Figure 4.. Acute alcohol increases Bcl-3– p50 complex formation.
(A) RAW 264.7 macrophages were stimulated with 100 ng/ml LPS or 50 mM ethanol or pretreated with ethanol as indicated and later challenged or not with LPS for 30 min. Equal amounts of nuclear proteins (∼300 μg) were immunoprecipitated with anti-p50 antibody or IgG (a negative control), and immune complexes were captured with anti-Bcl-3 antibody. The results are representative of two independent experiments. (B) Equal amount of whole cell proteins (300 μg) isolated from the livers of saline-treated mice (lanes 1–3), alcohol binge-treated mice (lanes 4–6), LPS-treated mice (lanes 7–9), and alcohol binge-treated mice challenged with LPS (lanes 10–12) were immunoprecipitated with anti-Bcl3 antibody or IgG control (lane 13) and immunoblotted (IB) with anti-p50 antibody. For loading control, equal amount of nuclear (A) or whole cell proteins (B) were loaded on separate gels and probed with anti-tata-binding protein (A) or actin (B).
Figure 5.
Figure 5.. Acute alcohol pretreatment increases Bcl-3 and p50 binding at the TNF-α promoter.
(A) Schematic representations of κb sites to the TNF-α promoter. (B–E) RAW 264.7 macrophages were stimulated with 50 mM ethanol or 100 ng/ml LPS or pretreated with alcohol for 7 h and challenged with LPS for 30 min and processed for ChIP analysis. The sonicated chromatin was immunoprecipitated with anti-p50 or anti-Bcl-3 or IgG antibody and reverse cross-linked with NaCl at 65°C, and finally, DNA was eluted with the Qiagen kit. The eluted DNA was analyzed by semiquantitative PCR with the primers specific to κB sites of TNF-α promoter. The densitometery data are shown as a bar graph from two independent experiments. Solid lines (B and D) indicate that samples were run on the same gel, however lanes were broken and pasted to a new position to present the data.
Figure 6.
Figure 6.. Knockdown of Bcl-3 prevents acute alcohol-induced inhibition of TNF-α.
(A–D) RAW 264.7 macrophages were transfected with Bcl-3 or control siRNA. (A and B) Knockdown efficiency of Bcl-3 siRNA was checked at the mRNA and protein levels by real-time PCR and Western blot analysis, respectively. (C) After 48 h of transfection, cells were stimulated or not with 100 ng/ml LPS or 50 mM ethanol, followed by LPS stimulation for 30 min, and total RNA was harvested and subjected to real-time PCR for TNF-α mRNA levels. The data were normalized to 18S and represent fold change compared with unstimulated cells. (D) For TNF-α production, cells were stimulated or not with LPS or ethanol and LPS for 6 h, and supernatants were collected and analyzed by ELISA after 72 h of the transfection. The data are presented as the mean value (sd as error bars) of at least three independent experiments (*P<0.05 vs. unstimulated cells; #P<0.05 compared with LPS alone-treated cells). ANOVA was used for statistical analysis.
Figure 7.
Figure 7.. Binge alcohol administration induces Bcl-3 in mice in response to LPS challenge.
Eight-week-old C57BL/6J female mice were orally gavaged with alcohol (n=6; 5 g/kg) or sucrose (n=4), as described in Materials and Methods. Three days later, mice received saline or LPS (0.5 mg/kg) i.p. for 3 h and were euthanized (n=4–6). (A, B, and D) Total RNA was isolated from the livers and processed to analyze the expression of Bcl-3 (A), TNF-α (B), and IL-10 (D) by real-time PCR using gene-specific primers and normalized to 18S. The protein levels of TNF-α (C) and IL-10 (E) were measured in the serum by ELISA. Data represent mean ± sem (*P<0.05 compared with saline-treated mice). ANOVA was used for statistical analysis.

References

    1. Szabo G., Mandrekar P. (2009) A recent perspective on alcohol, immunity, and host defense. Alcohol. Clin. Exp. Res. 33, 220–232 - PMC - PubMed
    1. Boe D. M., Nelson S., Zhang P., Quinton L., Bagby G. J. (2003) Alcohol-induced suppression of lung chemokine production and the host defense response to Streptococcus pneumoniae. Alcohol. Clin. Exp. Res. 27, 1838–1845 - PubMed
    1. Mandrekar P., Catalano D., Girouard L., Szabo G. (1996) Human monocyte IL-10 production is increased by acute ethanol treatment. Cytokine 8, 567–577 - PubMed
    1. Goral J., Kovacs E. J. (2005) In vivo ethanol exposure down-regulates TLR2-, TLR4-, and TLR9-mediated macrophage inflammatory response by limiting p38 and ERK1/2 activation. J. Immunol. 174, 456–463 - PubMed
    1. Oak S., Mandrekar P., Catalano D., Kodys K., Szabo G. (2006) TLR2- and TLR4-mediated signals determine attenuation or augmentation of inflammation by acute alcohol in monocytes. J. Immunol. 176, 7628–7635 - PubMed

Publication types

MeSH terms