Knock-down of methyl CpG-binding protein 2 (MeCP2) causes alterations in cell proliferation and nuclear lamins expression in mammalian cells
- PMID: 22783988
- PMCID: PMC3477090
- DOI: 10.1186/1471-2121-13-19
Knock-down of methyl CpG-binding protein 2 (MeCP2) causes alterations in cell proliferation and nuclear lamins expression in mammalian cells
Abstract
Background: MeCP2 (CpG-binding protein 2) is a nuclear multifunctional protein involved in several cellular processes, like large-scale chromatin reorganization and architecture, and transcriptional regulation. In recent years, a non-neuronal role for MeCP2 has emerged in cell growth and proliferation. Mutations in the MeCP2 gene have been reported to determine growth disadvantages in cultured lymphocyte cells, and its functional ablation suppresses cell growth in glial cells and proliferation in mesenchymal stem cells and prostate cancer cells. MeCP2 interacts with lamin B receptor (LBR) and with Heterochromatin Protein 1 (HP1) at the nuclear envelope (NE), suggesting that it could be part of complexes involved in attracting heterochromatin at the nuclear periphery and in mediating gene silencing. The nuclear lamins, major components of the lamina, have a role in maintaining NE integrity, in orchestrating mitosis, in DNA replication and transcription, in regulation of mitosis and apoptosis and in providing anchoring sites for chromatin domains.In this work, we inferred that MeCP2 might have a role in nuclear envelope stability, thereby affecting the proliferation pattern of highly proliferating systems.
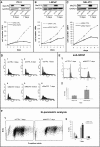
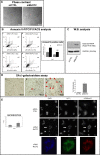
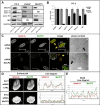
Results: By performing knock-down (KD) of MeCP2 in normal murine (NIH-3 T3) and in human prostate transformed cells (PC-3 and LNCaP), we observed a strong proliferation decrease and a defect in the cell cycle progression, with accumulation of cells in S/G2M, without triggering a strong apoptotic and senescent phenotype. In these cells, KD of MeCP2 evidenced a considerable decrease of the levels of lamin A, lamin C, lamin B1 and LBR proteins. Moreover, by confocal analysis we confirmed the reduction of lamin A levels, but we also observed an alteration in the shape of the nuclear lamina and an irregular nuclear rim.
Conclusions: Our results that indicate reduced levels of NE components, are consistent with a hypothesis that the deficiency of MeCP2 might cause the lack of a key "bridge" function that links the peripheral heterochromatin to the NE, thereby causing an incorrect assembly of the NE itself, together with a decreased cell proliferation and viability.
Figures


Similar articles
-
Interaction between the inner nuclear membrane lamin B receptor and the heterochromatic methyl binding protein, MeCP2.Exp Cell Res. 2009 Jul 1;315(11):1895-903. doi: 10.1016/j.yexcr.2009.01.019. Epub 2009 Feb 2. Exp Cell Res. 2009. PMID: 19331822
-
Loss of lamin B receptor is necessary to induce cellular senescence.Biochem J. 2017 Jan 15;474(2):281-300. doi: 10.1042/BCJ20160459. Epub 2016 Oct 19. Biochem J. 2017. PMID: 27760841
-
Nuclear pore protein TPR associates with lamin B1 and affects nuclear lamina organization and nuclear pore distribution.Cell Mol Life Sci. 2019 Jun;76(11):2199-2216. doi: 10.1007/s00018-019-03037-0. Epub 2019 Feb 14. Cell Mol Life Sci. 2019. PMID: 30762072 Free PMC article.
-
Laminopathies: what can humans learn from fruit flies.Cell Mol Biol Lett. 2018 Jul 6;23:32. doi: 10.1186/s11658-018-0093-1. eCollection 2018. Cell Mol Biol Lett. 2018. PMID: 30002683 Free PMC article. Review.
-
Lamin B receptor: multi-tasking at the nuclear envelope.Nucleus. 2010 Jan-Feb;1(1):53-70. doi: 10.4161/nucl.1.1.10515. Nucleus. 2010. PMID: 21327105 Free PMC article. Review.
Cited by
-
MicroRNA-4723 inhibits prostate cancer growth through inactivation of the Abelson family of nonreceptor protein tyrosine kinases.PLoS One. 2013 Nov 1;8(11):e78023. doi: 10.1371/journal.pone.0078023. eCollection 2013. PLoS One. 2013. PMID: 24223753 Free PMC article.
-
A Novel Role of Lamins from Genetic Disease to Cancer Biomarkers.Oncol Rev. 2016 Nov 14;10(2):309. doi: 10.4081/oncol.2016.309. eCollection 2016 Oct 10. Oncol Rev. 2016. PMID: 27994771 Free PMC article. Review.
-
Functional Profiling of Human MeCP2 by Automated Data Comparison Analysis and Computerized Expression Pathway Modeling.Healthc Inform Res. 2016 Apr;22(2):120-8. doi: 10.4258/hir.2016.22.2.120. Epub 2016 Apr 30. Healthc Inform Res. 2016. PMID: 27200222 Free PMC article.
-
Glaucoma related Proteomic Alterations in Human Retina Samples.Sci Rep. 2016 Jul 18;6:29759. doi: 10.1038/srep29759. Sci Rep. 2016. PMID: 27425789 Free PMC article.
-
Nuclear envelope structural proteins facilitate nuclear shape changes accompanying embryonic differentiation and fidelity of gene expression.BMC Cell Biol. 2017 Jan 14;18(1):8. doi: 10.1186/s12860-017-0125-0. BMC Cell Biol. 2017. PMID: 28088180 Free PMC article.
References
-
- Tao H, Huang C, Yang JJ, Ma TT, Bian EB, Zhang L, Lv XW, Jin Y, Li J. MeCP2 controls the expression of RASAL1 in the hepatic fibrosis in rats. Toxicology. 2011;290(2–3):327–333. - PubMed
-
- Joss-Moore LA, Wang Y, Ogata EM, Sainz AJ, Yu X, Callaway CW, McKnight RA, Albertine KH, Lane RH. IUGR differentially alters MeCP2 expression and H3K9Me3 of the PPARgamma gene in male and female rat lungs during alveolarization. Birth Defects Res A Clin Mol Teratol. 2011;91(8):672–681. doi: 10.1002/bdra.20783. - DOI - PMC - PubMed
Publication types
MeSH terms
Substances
LinkOut - more resources
Full Text Sources
Other Literature Sources
Molecular Biology Databases
Research Materials

