. 2013 Sep;23(9):2072-85.
doi: 10.1093/cercor/bhs187. Epub 2012 Jul 10.

Developmental changes in organization of structural brain networks

Collaborators, Affiliations

Developmental changes in organization of structural brain networks

Budhachandra S Khundrakpam et al. Cereb Cortex. 2013 Sep.

Abstract

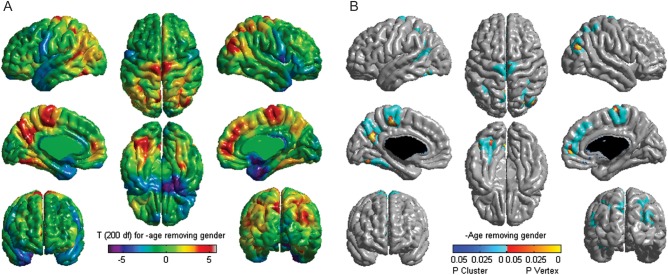
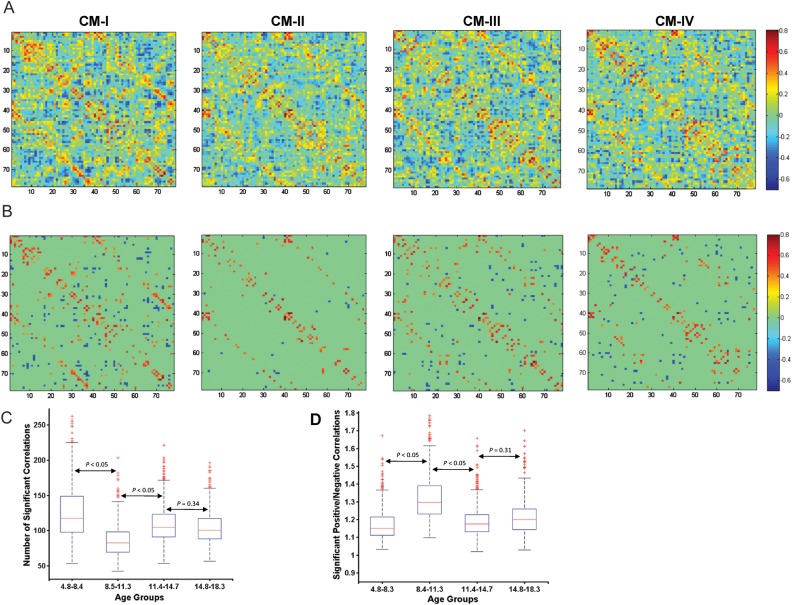
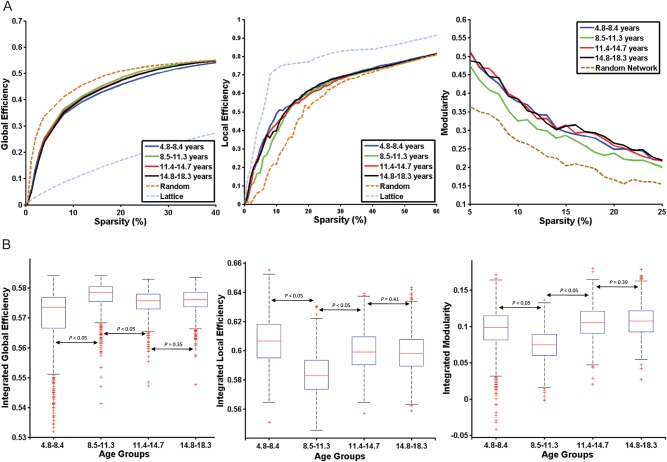
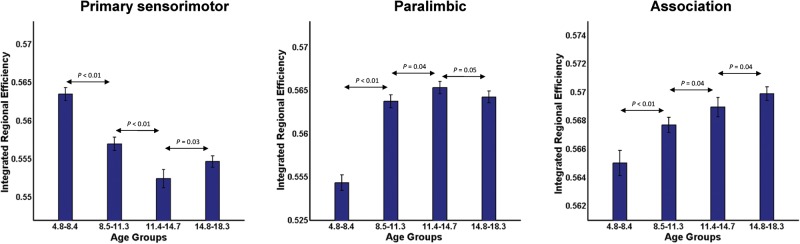
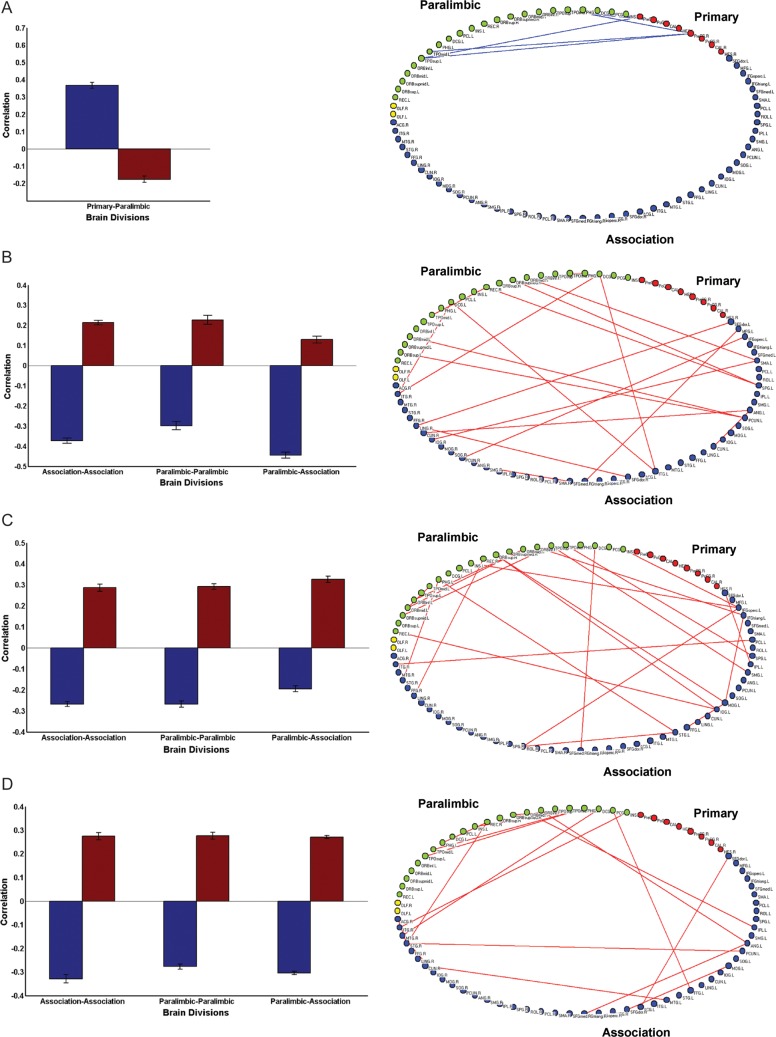
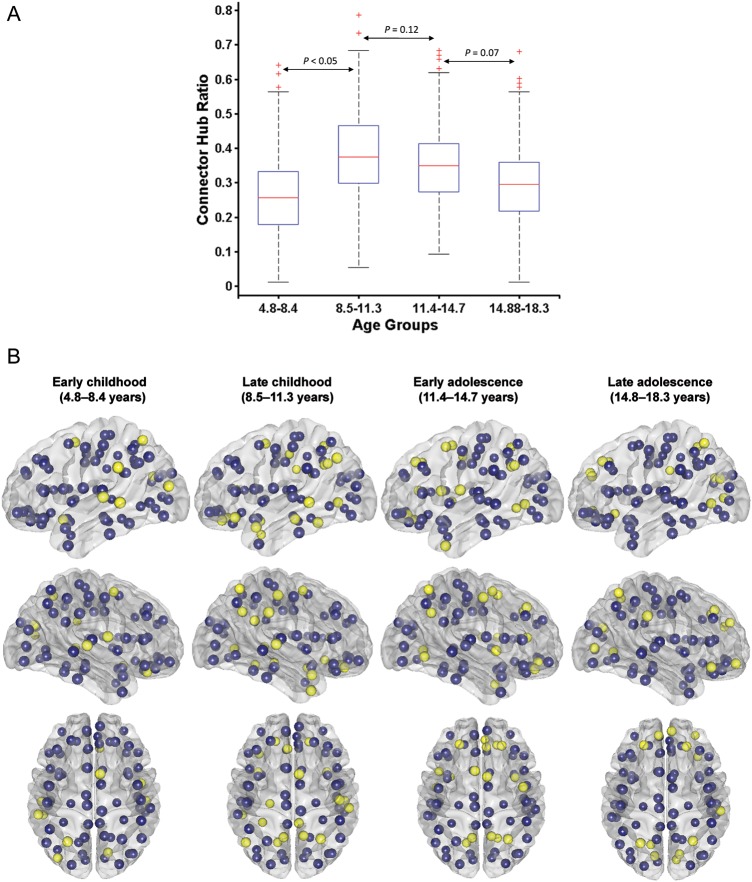
Recent findings from developmental neuroimaging studies suggest that the enhancement of cognitive processes during development may be the result of a fine-tuning of the structural and functional organization of brain with maturation. However, the details regarding the developmental trajectory of large-scale structural brain networks are not yet understood. Here, we used graph theory to examine developmental changes in the organization of structural brain networks in 203 normally growing children and adolescents. Structural brain networks were constructed using interregional correlations in cortical thickness for 4 age groups (early childhood: 4.8-8.4 year; late childhood: 8.5-11.3 year; early adolescence: 11.4-14.7 year; late adolescence: 14.8-18.3 year). Late childhood showed prominent changes in topological properties, specifically a significant reduction in local efficiency, modularity, and increased global efficiency, suggesting a shift of topological organization toward a more random configuration. An increase in number and span of distribution of connector hubs was found in this age group. Finally, inter-regional connectivity analysis and graph-theoretic measures indicated early maturation of primary sensorimotor regions and protracted development of higher order association and paralimbic regions. Our finding reveals a time window of plasticity occurring during late childhood which may accommodate crucial changes during puberty and the new developmental tasks that an adolescent faces.

Keywords: adolescence; connectivity; connector hub; cortical thickness; maturation.


Figures

Figure 1.
Figure 1.
Effect of age on cortical thickness. (A) Analysis of the effect of age on cortical thickness for the whole population (n = 203) using a vertex-wise general linear model in which age and gender were taken into account. T-statistic was used to test the main effect of age on cortical thickness. (B) Correction of multiple comparisons of the vertex data using random field theory.
Figure 2.
Figure 2.
Correlation matrix for age groups. (A) A matrix of Pearson correlation coefficients between inter-regional cortical thickness across subjects after removing for age, gender and mean thickness, denoted as CM-I for early childhood, CM-II for late childhood, CM-III for early adolescence, and CM-IV for late adolescence. (B) The correlation matrices after an FDR threshold of q = 0.05. Major changes in correlation in CM-II can be observed. (C) Statistical comparison of the number of significant correlations between the age groups using 1000 bootstrap samples of subjects. (D) Ratio of the number of significantly positive correlations to the number of significantly negative correlations. For more details, please see Materials and Methods.
Figure 3.
Figure 3.
Developmental changes in global topological parameters. (A) Global efficiency, local efficiency, and modularity for the 4 age groups as a function of sparsity. (B) Statistical comparisons of the graph metrics namely, integrated global efficiency, integrated local efficiency, and integrated modularity for sparsity range (5–25%) using 1000 bootstrap samples. The distributions of the 1000 summary graph metrics were checked for normality, and Student's t-test (for normal distribution) and Kolmogorov–Smirnov test (for non-normal distribution) were used to examine the significant difference of a summary graph metric between the 2 groups.
Figure 4.
Figure 4.
Regional efficiency of brain divisions. The integrated regional efficiencies of all cortical regions belonging to a functional brain division are aggregated and the same is used as a metric to compare between age groups. The standard error is represented by the bar and P-values were calculated using Student's t-test.
Figure 5.
Figure 5.
Developmental to in inter-regional connectivity. (A) Changes in connectivity from early to late childhood are computed by comparing the mean correlation of cortical regions belonging 2 brain divisions (for details, see Materials and Methods). Decreased connectivity is observed between primary sensorimotor and paralimbic regions and visualized on a 2D brain layout. (B) Increased connectivity is observed between association and paralimbic, and within association, paralimbic regions from early to late childhood. (C) From late childhood to early adolescence, increased connectivity is observed between association and paralimbic, and within paralimbic and association regions. (D) From early to late adolescence, increased connectivity is observed between association and paralimbic, and within paralimbic, and association regions.
Figure 6.
Figure 6.
Developmental changes in connector hub distribution. (A) Statistical comparison of connector hubs for the age groups using 1000 bootstrap samples. Student's t-test is used for checking significance between 2 age groups. (B) Connector hub distribution for the age groups. Yellow ones represent cortical regions that are identified as connector hubs (with participation index, P > 0.62; for details, see Materials and Methods), while blue ones are the rest of the cortical regions.

References

    1. Achard S, Bullmore E. Efficiency and cost of economical brain functional networks. PLoS Comput Biol. 2007;3:e17. doi:10.1371/journal.pcbi.0030017. - DOI - PMC - PubMed
    1. Amso D, Casey BJ. Beyond what develops when: neuroimaging may inform how cognition changes with development. Curr Dir Psychol Sci. 2006;15:24–29. doi:10.1111/j.0963-7214.2006.00400.x. - DOI
    1. Andersen SL. Trajectories of brain development: point of vulnerability or window of opportunity? Neurosci Biobehav Rev. 2003;27:3–18. doi:10.1016/S0149-7634(03)00005-8. - DOI - PubMed
    1. Anderson VA, Anderson P, Northam E, Jacobs R, Catroppa C. Development of executive functions through late childhood and adolescence in an Australian sample. Dev Neuropsychol. 2001;20:385–406. doi:10.1207/S15326942DN2001_5. - DOI - PubMed
    1. Andrews TJ, Halpern SD, Purves D. Correlated size variations in human visual cortex, lateral geniculate nucleus, and optic tract. J Neurosci. 1997;17:2859–2868. - PMC - PubMed

Publication types