. 2012 Nov 15;63(3):1646-69.
doi: 10.1016/j.neuroimage.2012.06.065. Epub 2012 Jul 8.

Subject-specific functional localizers increase sensitivity and functional resolution of multi-subject analyses

Affiliations

Subject-specific functional localizers increase sensitivity and functional resolution of multi-subject analyses

Alfonso Nieto-Castañón et al. Neuroimage. .

Abstract

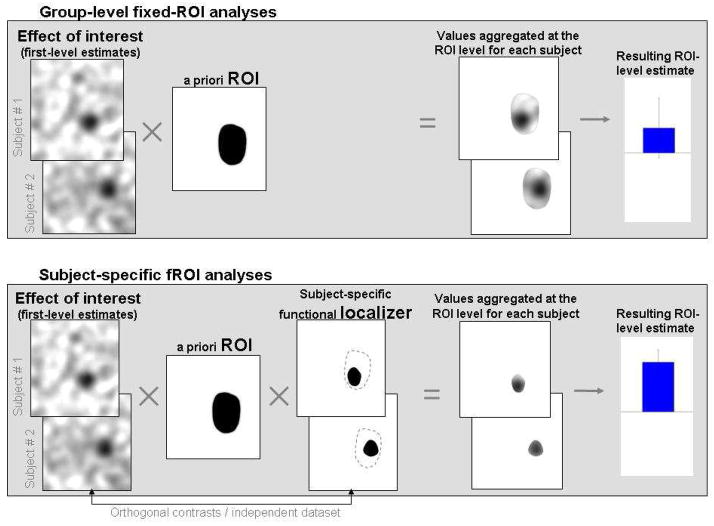
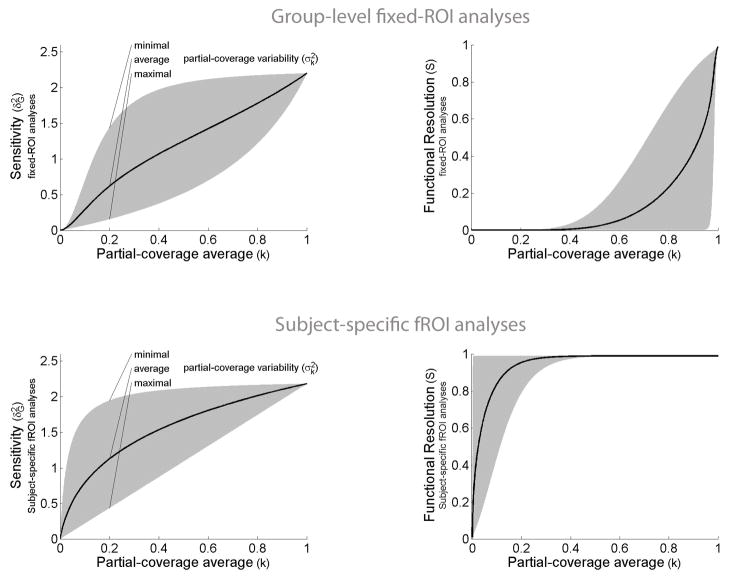
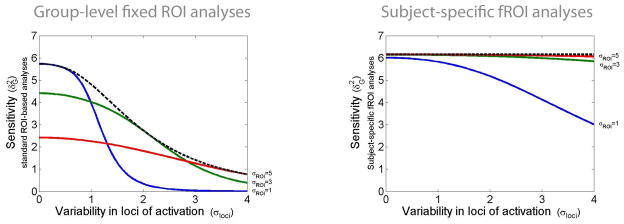
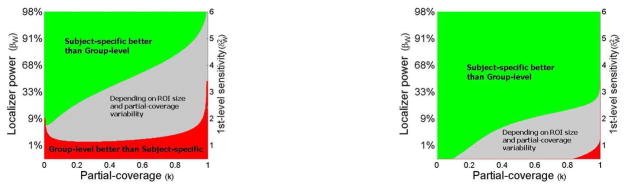
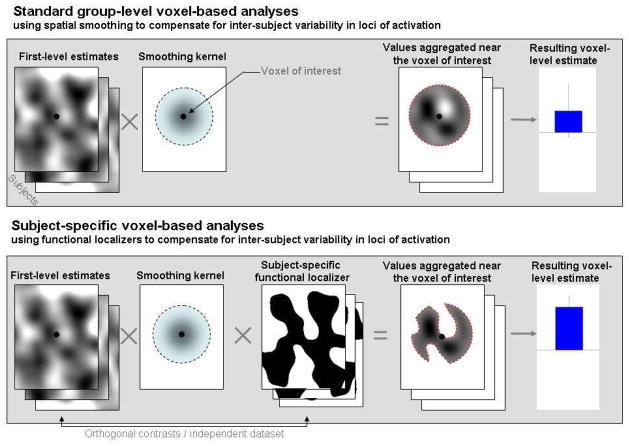
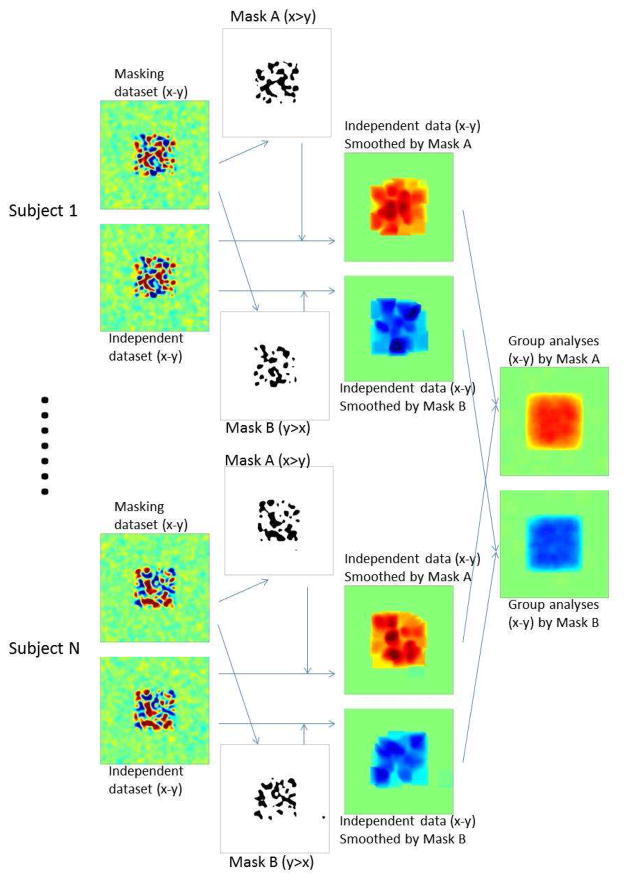
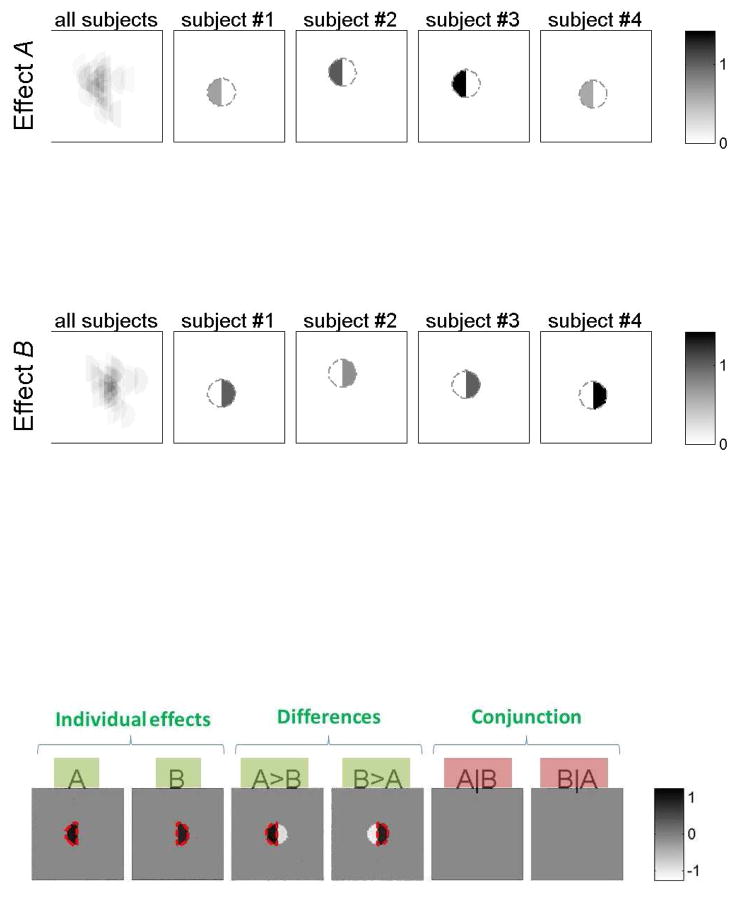
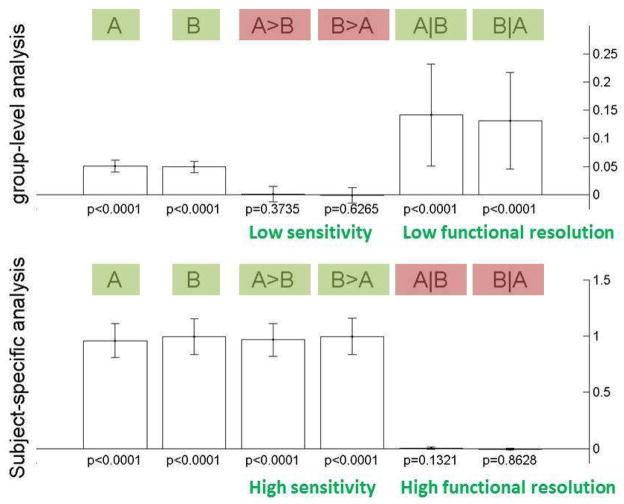
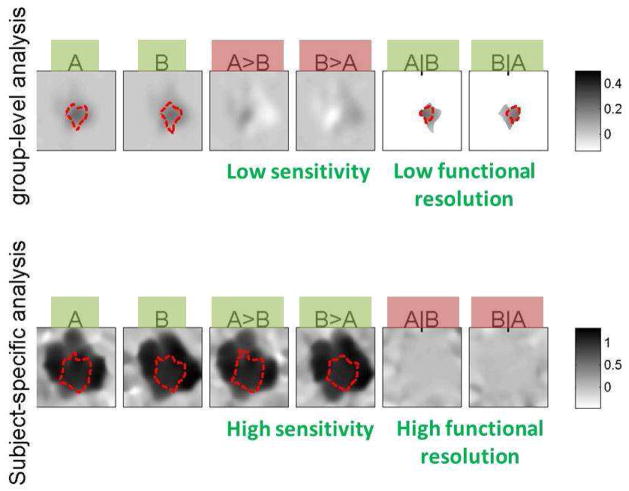
One important goal of cognitive neuroscience is to discover and explain properties common to all human brains. The traditional solution for comparing functional activations across brains in fMRI is to align each individual brain to a template brain in a Cartesian coordinate system (e.g., the Montreal Neurological Institute template). However, inter-individual anatomical variability leads to decreases in sensitivity (ability to detect a significant activation when it is present) and functional resolution (ability to discriminate spatially adjacent but functionally different neural responses) in group analyses. Subject-specific functional localizers have been previously argued to increase the sensitivity and functional resolution of fMRI analyses in the presence of inter-subject variability in the locations of functional activations (e.g., Brett et al., 2002; Fedorenko and Kanwisher, 2009, 2011; Fedorenko et al., 2010; Kanwisher et al., 1997; Saxe et al., 2006). In the current paper we quantify this dependence of sensitivity and functional resolution on functional variability across subjects in order to illustrate the highly detrimental effects of this variability on traditional group analyses. We show that analyses that use subject-specific functional localizers usually outperform traditional group-based methods in both sensitivity and functional resolution, even when the same total amount of data is used for each analysis. We further discuss how the subject-specific functional localization approach, which has traditionally only been considered in the context of ROI-based analyses, can be extended to whole-brain voxel-based analyses. We conclude that subject-specific functional localizers are particularly well suited for investigating questions of functional specialization in the brain. An SPM toolbox that can perform all of the analyses described in this paper is publicly available, and the analyses can be applied retroactively to any dataset, provided that multiple runs were acquired per subject, even if no explicit "localizer" task was included.


Figures

Figure 1
Figure 1. A schematic illustration of ROI-based analyses
Top panel: An a priori ROI is intersected with each subject’s activation map for the effect of interest. ROI-level measures are estimated by aggregating the BOLD data (or single-subject effect estimates) across all of the voxels within the ROI. Bottom panel: An a priori ROI is intersected with each subject’s functional localizer mask. ROI-level measures are estimated by aggregating the BOLD data across all of the voxels within the resulting subject-specific areas. Note that the data used to derive the values that are aggregated at the ROI level for each subject must come from data left out of the localizer, or from a different, orthogonal contrast (Vul & Kanwisher, 2010).
Figure 2
Figure 2. Sensitivity (left) and functional resolution (right) of group-level fixed-ROI analyses (top) and subject-specific fROI analyses (bottom) as a function of partial-coverage values
Top panel: The sensitivity and functional resolution of group-level fixed-ROI analyses are detrimentally affected by inter-subject variability in the loci of activation. This detrimental effect can be characterized as a function of the average and variability of partial-coverage values across subjects. The sensitivity (y-axis, left plot) and functional resolution (y-axis, right plot) of group-level fixed-ROI analyses is plotted for different levels of partial-coverage average values (x-axis), and for all possible partial-coverage variability values (gray area). (Partial-coverage values represent the proportion of activated voxels within an ROI relative to the total number of voxels in the ROI.) Bottom panel: The sensitivity (y-axis, left plot) and functional resolution (y-axis, right plot) of subject-specific fROI analyses are plotted for different levels of partial-coverage average values (x- axis), and for all sensible partial-coverage variability values (gray area). Compared to the fixed-ROI case (top panel), both sensitivity and functional resolution show a reduced detrimental effect of lower partial-coverage values or higher partial-coverage variability.
Figure 3
Figure 3. Sensitivity of group-level fixed-ROI analyses (left) and subject-specific fROI analyses (right) as a function of spatial variability in the loci of activations and as a function of the ROI size
Left: The sensitivity of multi-subject fixed-ROI analyses (y-axis) is plotted for different levels of inter-subject variability in the loci of activation (x-axis) for three different ROI sizes (solid lines). ROI sizes that approximately encompass the extent of activation across subjects (dotted line) are optimal, yet the sensitivity of such ROIs still decreases with increasing inter-subject variability in the loci of activation. Theoretical sensitivity values estimated for a spherical Gaussian-distributed activation with size parameter σact (fixed to a value of 1, representing approximately an activation extent of 12 voxels FWHM assuming 1 resel = 125 voxels) and with the loci of this activation varying randomly between subjects following a Gaussian distribution in center positions (with σloci varying from 0 to 4 characterizing the inter-subject variability in the loci of activation). The ROI is similarly characterized as encompassing an isotropic Gaussian sphere with size parameter σROI (varying from 1 to 5). Right: The sensitivity of multi-subject subject-specific fROI analyses (y-axis) is plotted for different levels of inter-subject variability in the loci of activation (x-axis) for three different ROI sizes (solid lines). ROI sizes that minimally encompass the extent of activation across subjects are optimal (cf. matched filter theorem). In addition, the sensitivity of optimally-sized ROIs (dotted line) is not detrimentally affected by increasing inter-subject variability in the loci of activation.
Figure 4
Figure 4. A comparison of multi-subject sensitivity (left) and functional resolution (right) in subject-specific fROI analyses vs. group-level fixed-ROI analyses
The plot displays the relative advantages of the subject-specific fROI method compared to the group-level fixed-ROI method, for a range of single-subject design sensitivities (y-axis) and average partial-coverage values (x-axis). Both methods are constrained to use the same limited amount of functional data. The ‘quality’ of the data is represented by the 1st-level design sensitivity (y-axis, where higher values correspond to stronger effects, less noise, and/or longer acquisitions). For any given partial-coverage value, the subject-specific fROI methodology will result in increased multi-subject sensitivity and functional resolution compared to the fixed-ROI methodology as long as the single-subject design is sufficiently high-powered (green area).
Figure 5
Figure 5. Sensitivity of voxel-based analyses as a function of spatial variability in the loci of activations and as a function of within- and between-subject sensitivities
The sensitivity of multi-subject voxel-based analyses (y-axis) is plotted for different levels of inter-subject variability in the loci of activation, i.e., different proportion overlap values (x-axis) for a normal range of within- and between-subject sensitivity levels (Desmond & Glover, 2002) (solid lines). The dotted line shows the maximal power achievable by any (arbitrarily high) set of within- and between- subject sensitivities (that depend on how many scans we perform for each subject, and how strong and consistent the underlying effect is in the subjects where it is present), highlighting the fact that partial across-subject overlap imposes a concrete and severe limit on the maximal power achievable in group-level voxel-based analyses, and the size of this detrimental effect depends on the level of overlap.
Figure 6
Figure 6. A schematic illustration of the use of functional localizers in the context of voxel-based analyses
Standard voxel-level analyses (top) that use smoothing as a way to compensate for inter-subject variability in the loci of activation aggregate, for each voxel, the BOLD data (or single-subject estimates) across a surrounding area defined by the smoothing kernel support. The application of functional localizers in the context of voxel-based analyses (bottom) limits this aggregation to only those surrounding voxels within the subject-specific functional localizer mask (obtained from an orthogonal contrast or independent dataset). In the presence of inter-subject variability in the loci of activation this approach offers higher sensitivity and functional resolution, and a reduction of bias, in the resulting voxel-level estimates.
Figure 7
Figure 7. Diagram describing subject-specific voxel-level analysis steps, in the presence of a distributed representation of two opposite effects
Each subject’s data is divided into a masking dataset and a second independent dataset where statistical inferences will be evaluated. The masking dataset is used to derive subject-specific functional localizers for the two contrasts of interest (mask A for a x>y contrast, and mask B for the opposite y>x contrast). The independent dataset for each subject is then smoothed using two separate procedures, which operate only over voxels in mask A or B, respectively. Aggregating the resulting maps across multiple subjects allows the discovery of opposite distributed effects within the same area.
Figure 8
Figure 8. Spatial distribution of simulated data
Withinan area of 100 × 100 voxels, the entire activation of interest for each subject (n=25) was assumed to lie within a sphere with a radius of 10 voxels. The left half of this sphere, for each subject, responded to stimulus A and the right half responded to stimulus B. The location of the sphere of activation varied randomly for each subject (with a standard deviation of 10 voxels). Top: The leftmost plots display the overlap among all of the subjects’ response to each stimulus type. The four plots to the right show examples of the response strength and location of voxels activated by each condition in four sample subjects (added noise not shown). Color coded is the strength of the BOLD responses (average 1% BOLD signal change). Note that the responses to A and B are fully spatially separated for each subject (there is no individual voxel that responds to both A and B). Bottom: If there was no inter-subject variability in the loci of activation (i.e., if the spheres of activation perfectly aligned across subjects) a voxel-wise analysis would correctly indicate that: a) there are some areas that respond to A and/or B, and the effect sizes of the responses are approximately 1% BOLD signal change for each condition (individual effects plots; dotted red line represents significant areas); b) these same areas respond differentially to the two stimuli (differences plots A>B and B>A); and c) there are no areas that respond jointly to both stimuli (conjunction plots A|B and B|A). Contrast inferences that are expected to be answered positively for at least some analysis unit are marked in green (A, B, A>B, and B>A), while those that are expected to be answered negatively for all analysis units are marked in red (A|B, and B|A).
Figure 9
Figure 9. Simulation results: ROI-based methods
Group-level fixed-ROI analyses (top) compared to subject-specific fROI analyses (bottom) on the same simulated dataset. Top: In the presence of inter-subject variability in the loci of activation group-level ROI-based results fail to find significant activation differences between the two conditions A and B (A>B or B>A, p>.37), and incorrectly find significant responses to the conjunction of A and B (p<.0001). Bottom: Subject-specific fROI analyses result in the correct inferences in all cases (p<.0001 for A>B and B>A tests, and p>.13 for A|B and B|A tests). Significant effects are marked in green and non-significant effects are marked in red (compare to expected behavior in the absence of inter-subject variability, Figure 10 bottom plot).
Figure 10
Figure 10. Simulation results: voxel-based methods
Group-level voxel-based analyses with spatial smoothing (top) compared to subject-specific voxel-based analyses (bottom) on the same simulated dataset. Top: In the presence of inter-subject variability in the loci of activation group-level voxel-based results fail to find significant activation differences between the two conditions A and B (A>B or B>A hypotheses, no significant voxels using a height threshold level of p<.001), and incorrectly find significant responses to the conjunction of A and B (A|B and B|A hypotheses result in a cluster of 241 voxels at the same threshold level). Bottom: Subject-specific voxel-based analyses result in the correct inferences in all cases (large clusters at a height threshold of p<.001 for the A>B and B>A hypotheses, and no significant voxels at this same threshold level for the A|B and B|A hypotheses). Significant effects are marked in green and non-significant effects are marked in red (compare to expected behavior in the absence of inter-subject variability, Figure 10 bottom plot).

References

    1. Aguirre GK, Detre JA. The development and future of perfusion fMRI for dynamic imaging of human brain activity. NeuroImage (in press) - PubMed
    1. Amunts K, Schleicher A, Bürgel U, Mohlberg H, Uylings HB, Zilles K. Broca’s region revisited: Cytoarchitecture and intersubject variability. J Comp Neurol. 1999;412(2):319–41. - PubMed
    1. Barbier EL, Marrett S, Danek A, Vortmeyer A, van Gelderen P, Duyn J, Bandettini P, Grafman J, Koretsky AP. Imaging cortical anatomy by high-resolution MR at 3.0T: Detection of the stripe of Gennari in visual area 17. Magn Reson Med. 2002;48:735–738. - PubMed
    1. Binkofski F, Amunts K, Stephan KM, Posse S, Schormann T, Freund HJ, et al. Broca’s region subserves imagery of motion: A combined cytoarchitectonic and fmri study. Hum Brain Mapp. 2000;11(4):273–85. - PMC - PubMed
    1. Brett M, Johnsrude IS, Owen AM. The problem of functional localization in the human brain. Nature Reviews Neuroscience. 2002;3(3):243–249. - PubMed

Publication types

MeSH terms