. 2012 Nov;52(5):355-65.
doi: 10.1016/j.ceca.2012.05.012. Epub 2012 Jul 10.

Switch from ER-mitochondrial to SR-mitochondrial calcium coupling during muscle differentiation

Affiliations

Switch from ER-mitochondrial to SR-mitochondrial calcium coupling during muscle differentiation

Muqing Yi et al. Cell Calcium. 2012 Nov.

Abstract

Emerging evidence indicates that mitochondria are locally coupled to endoplasmic reticulum (ER) Ca2+ release in myoblasts and to sarcoplasmic reticulum (SR) Ca2+ release in differentiated muscle fibers in order to regulate cytoplasmic calcium dynamics and match metabolism with cell activity. However, the mechanism of the developmental transition from ER to SR coupling remains unclear. We have studied mitochondrial sensing of IP3 receptor (IP3R)- and ryanodine receptor (RyR)-mediated Ca2+ signals in H9c2 myoblasts and differentiating myotubes, as well as the attendant changes in mitochondrial morphology. Mitochondria in myoblasts were largely elongated, luminally connected and relatively few in number, whereas the myotubes were densely packed with globular mitochondria that displayed limited luminal continuity. Vasopressin, an IP3-linked agonist, evoked a large cytoplasmic Ca2+ ([Ca2+]c) increase in myoblasts, whereas it elicited a smaller response in myotubes. Conversely, RyR-mediated Ca2+ release induced by caffeine, was not observed in myoblasts, but triggered a large [Ca2+]c signal in myotubes. Both the IP3R and the RyR-mediated [Ca2+]c rise was closely associated with a mitochondrial matrix Ca2+ ([Ca2+]m) signal. Every myotube that showed a [Ca2+]c spike also displayed a [Ca2+]m response. Addition of IP3 to permeabilized myoblasts and caffeine to permeabilized myotubes also resulted in a rapid [Ca2+]m rise, indicating that Ca2+ was delivered via local coupling of the ER/SR and mitochondria. Thus, as RyRs are expressed during muscle differentiation, the local connection between RyR and mitochondrial Ca2+ uptake sites also appears. When RyR1 was exogenously introduced to myoblasts by overexpression, the [Ca2+]m signal appeared together with the [Ca2+]c signal, however the mitochondrial morphology remained unchanged. Thus, RyR expression alone is sufficient to induce the steps essential for their alignment with mitochondrial Ca2+ uptake sites, whereas the mitochondrial proliferation and reshaping utilize either downstream or alternative pathways.


Figures

Figure 1
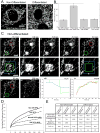
Figure 1. Mitochondrial morphology and dynamics in H9c2 myoblasts and myotubes
(A) Confocal images of typical non-differentiated (left) and differentiated (right) H9c2 cells loaded with MitoTracker Green FM. The mitochondria of the non-differentiated cell are found predominantly in tubular structures versus the mix of short tubular and globular morphologies in the differentiated cell. (B) Comparison of the mitochondrial density in differentiated, non-differentiated and RyR1-expressing non-differentiated H9c2 cells measured as the fraction of the cell area occupied by mitochondria in confocal micrographs. (Values shown are mean ± SE from 25-30 cells per condition.) (C) Confocal images from a typical FLIP/FRAP experiment with MitoTracker Green stained non-differentiated H9c2 cells under standard conditions: (i) Prebleach, (ii-iv) during bleaching, (v) immediately after bleaching and (vi,vii) during recovery. A close-up of the lower bleaching region is shown (i-v, lower row). The area for FLIP measurement is the area inside the blue box and outside the bleaching area (green box). The loss of fluorescence in the FLIP area of mitochondria partly in the bleach area is visible. The photobleaching resulting from the continuous monitoring of the cell (vii) is evident. (viii) Quantitative analysis of FLIP for the lower region of this cell. (ix) Fluorescence recovery curves after normalization for this cell. (D) Comparison of the fluorescence recovery kinetics of differentiated and non-differentiated cells under standard conditions (solid line and long dash) and at 23 °C when treated with Nocodazole to reduce the movement of the mitochondria (medium dash and short dash). (E) Summary of FLIP/FRAP data comparing differentiated and non-differentiated H9c2. (Values shown are mean ± SE.)
Figure 2
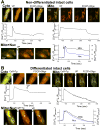
Figure 2. IP3R- and RyR-mediated [Ca2+]c, [Ca2+]mand [Ca2+]nsignals in myoblasts and myotubes
Non-differentiated (A) and differentiated (B) intact H9c2 cells were transfected with ratiometric pericam (pericam) targeted to the cytosol (Cyto), mitochondria (Mito) or to the nucleus and mitochondria (Mito+Nuc). Myoblasts were stimulated first with vasopressin (VP 100 nM) and myotubes with caffeine (Caff 10mM). To maximize the activation of RyR-mediated Ca2+ release, thapsigargin (Tg 2μM) was added together with caffeine. To test for residual IP3-sensitive Ca2+ stores in the myotubes, VP was also applied following the caffeine stimulus. At the end of the recording uncoupler (FCCP, 5 μM/oligomycin 5 μg/ml) was added to release Ca2+ from mitochondria. The images show the distribution of the pericam (490nm excitation in red, 415nm excitation in green); note the increase of the red and decrease of the green components upon [Ca2+] elevation. The graphs below/next to the images show the corresponding time course of the pericam ratio (495nm/415nm) recorded and averaged from the cells shown.
Figure 3
Figure 3. IP3R- and RyR-dependent [Ca2+]n and [Ca2+]m signals in permeabilized myoblasts and myotubes
Non-differentiated (A) and differentiated (B) cells transfected with pericams were digitonin-permeabilized in intracellular medium and treated as in Figure 2, except that only [Ca2+]n and [Ca2+]m (no [Ca2+]c) were recorded and IP3R/RyR were directly stimulated by IP3 (10 μM) and Caff (10 mM), respectively.
Figure 4
Figure 4. RyR-and IP3R-dependent [Ca2+]c and [Ca2+]m signals in myoblasts overexpressing RyR1
Fluorescence imaging of [Ca2+]m (A,B) and [Ca2+]c (C,D) in non-differentiated intact cells transfected with pericam only (A,C) or co-transfected with RyR1 cDNA from rabbit skeletal muscle (B,D). RyR and IP3R-dependent Ca2+ signals were stimulated sequentially using Caff (10 mM) and VP (100 nM), respectively. The time course traces on the right are either the means recorded from the cells shown on the field (for the mono-transfections A,C) or correspond to the letter-labeled individual cells (for the co-transfections B,D).
Figure 5
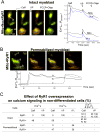
Figure 5. RyR-and IP3R-dependent [Ca2+]m signal generation in myoblasts overexpressing RyR1
Simultaneous recording of [Ca2+]n and [Ca2+]m in non-differentiated intact cells (A) or [Ca2+]m in permeabilized non-differentiated cells (B) co-transfected with pericam(s) and RyR1. Imaging was carried out 24-36 h after transfection. RyR was activated by Caff (10 mM), while IP3R-dependent Ca2+ signals were stimulated using VP (100 nM) in intact, or directly by IP3 (10 μM) in the permeabilized cells. The table (C) summarizes the results of the imaging experiments studying the [Ca2+]c, [Ca2+]n and [Ca2+]m responses to Caff and VP/IP3 in RyR1 overexpressing and control cells. Note the obligatory correlation of the Caff-induced [Ca2+]n and [Ca2+]m signals.
Figure 6
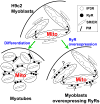
Figure 6. Scheme showing the effect of myogenic differentiation and RyR1 expression on ER/SR-mitochondrial calcium signaling in H9c2 myoblasts
For the sake of simplicity, RyRs are depicted at the SR-mitochondrial interface but in skeletal and cardiac muscle RyRs are localized on the far side of the terminal cisternae associated with the mitochondria [18].

Similar articles

Cited by

References

    1. Shore GC, Tata JR. Two fractions of rough endoplasmic reticulum from rat liver. I. Recovery of rapidly sedimenting endoplasmic reticulum in association with mitochondria. J Cell Biol. 1977;72:714–25. - PMC - PubMed
    1. Rusinol AE, Cui Z, Chen MH, Vance JE. A unique mitochondria-associated membrane fraction from rat liver has a high capacity for lipid synthesis and contains pre-Golgi secretory proteins including nascent lipoproteins. J Biol Chem. 1994;269:27494–502. - PubMed
    1. Rizzuto R, Pinton P, Carrington W, Fay FS, Fogarty KE, Lifshitz LM, Tuft RA, Pozzan T. Close contacts with the endoplasmic reticulum as determinants of mitochondrial Ca2+ responses. Science. 1998;280:1763–6. - PubMed
    1. Csordas G, Renken C, Varnai P, Walter L, Weaver D, Buttle KF, Balla T, Mannella CA, Hajnoczky G. Structural and functional features and significance of the physical linkage between ER and mitochondria. J Cell Biol. 2006;174:915–21. - PMC - PubMed
    1. de Brito OM, Scorrano L. Mitofusin 2 tethers endoplasmic reticulum to mitochondria. Nature. 2008;456:605–10. - PubMed

Publication types

MeSH terms

Substances