. 2012 Jul 11;2(1):26.
doi: 10.1186/2110-5820-2-26.

Can endotracheal bioimpedance cardiography assess hemodynamic response to passive leg raising following cardiac surgery?

Affiliations

Can endotracheal bioimpedance cardiography assess hemodynamic response to passive leg raising following cardiac surgery?

Jean-Luc Fellahi et al. Ann Intensive Care. .

Abstract

Background: The utility of endotracheal bioimpedance cardiography (ECOM) has been scarcely reported. We tested the hypothesis that it could be an alternative to pulse contour analysis for cardiac index measurement and prediction in fluid responsiveness.

Methods: Twenty-five consecutive adult patients admitted to the intensive care unit following conventional cardiac surgery were prospectively included and investigated at baseline, during passive leg raising, and after fluid challenge. Comparative cardiac index data points were collected from pulse contour analysis (CIPC) and ECOM (CIECOM). Correlations were determined by linear regression. Bland-Altman analysis was used to compare the bias, precision, and limits of agreement. Percentage error was calculated. Changes in CIPC (ΔCIPC) and CIECOM (ΔCIECOM) during passive leg raising were collected to assess their discrimination in predicting fluid responsiveness.

Results: A significant relationship was found between CIPC and CIECOM (r = 0.45; P < 0.001). Bias, precision, and limits of agreement were 0.44 L.min-1.m-2 (95% confidence interval, 0.33-0.56), 0.59 L.min-1.m-2, and -0.73 to 1.62 L.min-1.m-2, respectively. Percentage error was 45%. A significant relationship was found between percent changes in CIPC and CIECOM after fluid challenge (r = 0.42; P = 0.035). Areas under the ROC curves for ΔCIPC and ΔCIECOM to predict fluid responsiveness were 0.72 (95% confidence interval, 0.5-0.88) and 0.81 (95% confidence interval, 0.61-0.94), respectively.

Conclusions: ECOM is not interchangeable with pulse contour analysis but seems consistent to monitor cardiac index continuously and could help to predict fluid responsiveness by using passive leg raising.


Figures
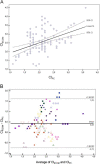
Figure 1
Figure 1
Relationship between CIPCand CIECOMin 25 patients (100 paired data points). The linear fit is given with 95% confidence interval (A); Bland-Altman analysis between CIPC and CIECOM in 25 patients (100 paired data points). The mean bias is given with its limits of agreement (B). CIECOM = cardiac index determination using ECOM (L.min-1.m-2); CIPC = cardiac index determination using pulse contour analysis (L.min-1.m-2).
Figure 2
Figure 2
CIPCand CIECOMat baseline, during passive leg raising and after fluid challenge in responders (black boxes) and non responders (striated grey boxes). Values are mean ± SD. P value refers to ANOVA (two-factor study with repeated measures on one factor). CIECOM = cardiac index determination using ECOM (L.min-1.m-2); CIPC = cardiac index determination using pulse contour analysis (L.min-1.m-2); PLR = passive leg raising.
Figure 3
Figure 3
Relationship between percent changes in cardiac index determination using ECOM (ΔCIPC) and cardiac index determination using pulse contour analysis (ΔCIECOM) following fluid challenge in 25 patients (25 paired data points). The linear fit is given with 95% confidence interval.
Figure 4
Figure 4
ROC curves showing the relationship between sensitivity and specificity in determining the discrimination of ΔCIPCand ΔCIECOMin predicting fluid responsiveness. The dotted diagonal line is the no-discrimination curve. No significant difference was found between ROC curves. ΔCIECOM = change in cardiac index ECOM during passive leg raising; ΔCIPC = change in cardiac index pulse contour analysis during passive leg raising; ROC = receiver operating characteristic curve.

Similar articles

Cited by

References

    1. Marik PE, Cavallazzi R, Vasu T, Hirani A. Dynamic changes in arterial waveform derived variables and fluid responsiveness in mechanically ventilated patients: a systematic review of the literature. Crit Care Med. 2009;37:2642–2647. doi: 10.1097/CCM.0b013e3181a590da. - DOI - PubMed
    1. Cannesson M. Arterial pressure variation and goal-directed fluid therapy. J Cardiothorac Vasc Anesth. 2010;24:487–497. doi: 10.1053/j.jvca.2009.10.008. - DOI - PubMed
    1. Maguire S, Rinehart J, Vakharia S, Cannesson M. Respiratory variation in pulse pressure and plethysmographic waveforms: intraoperative applicability in a North American academic center. Anesth Analg. 2011;112:94–96. doi: 10.1213/ANE.0b013e318200366b. - DOI - PubMed
    1. Cannesson M, Le Manach Y, Hofer CK, Goarin JP, Lehot JJ, Vallet B, Tavernier B. Assessing the diagnostic accuracy of pulse pressure variations for the prediction of fluid responsiveness: a "Gray Zone" approach. Anesthesiology. 2011;115:231–241. doi: 10.1097/ALN.0b013e318225b80a. - DOI - PubMed
    1. Boulain T, Achard JM, Teboul JL, Richard C, Perrotin D, Ginies G. Changes in BP induced by passive leg raising predict response to fluid loading in critically ill patients. Chest. 2002;121:1245–1252. doi: 10.1378/chest.121.4.1245. - DOI - PubMed

LinkOut - more resources