. 2012 Jul 11;487(7406):183-9.
doi: 10.1038/nature11160.

Anhedonia requires MC4R-mediated synaptic adaptations in nucleus accumbens

Affiliations

Anhedonia requires MC4R-mediated synaptic adaptations in nucleus accumbens

Byung Kook Lim et al. Nature. .

Abstract

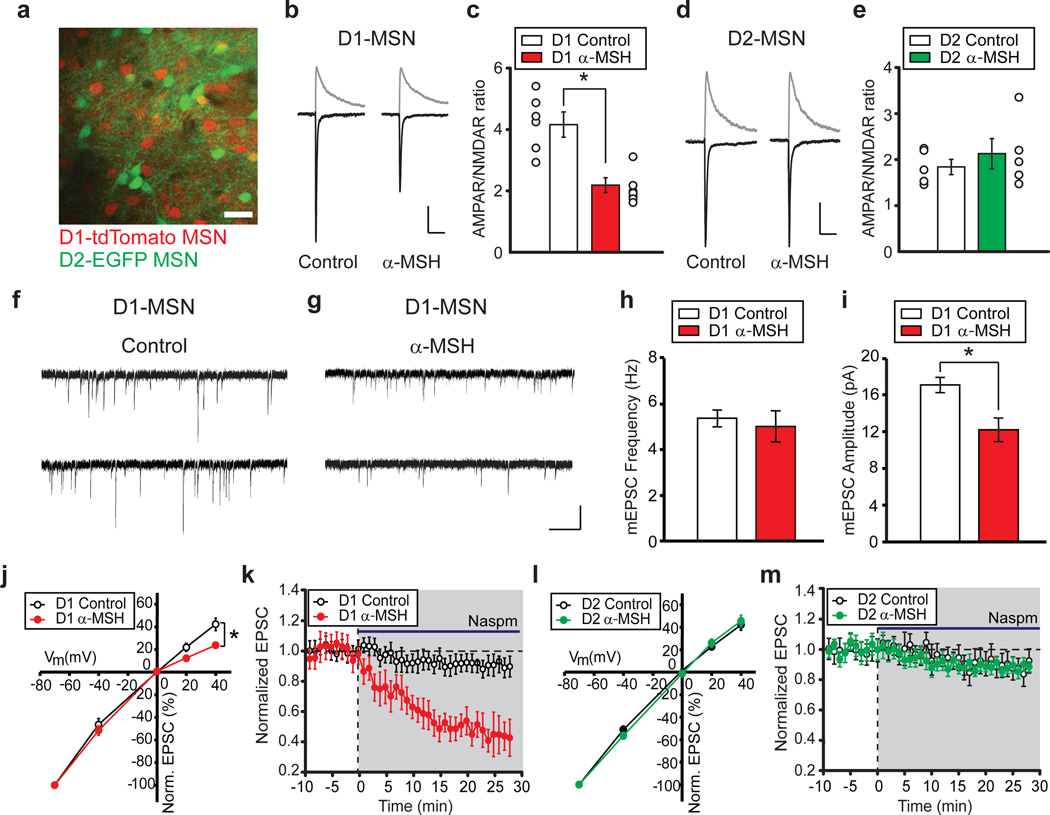
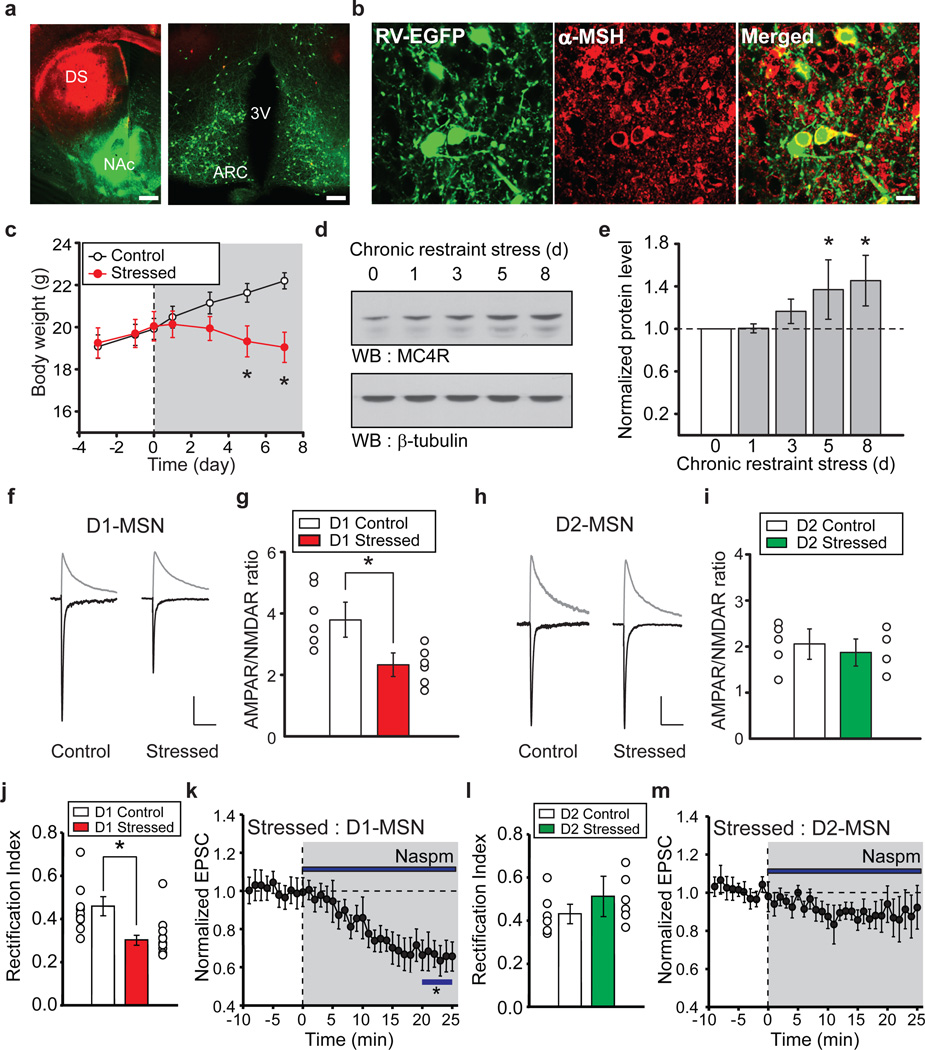
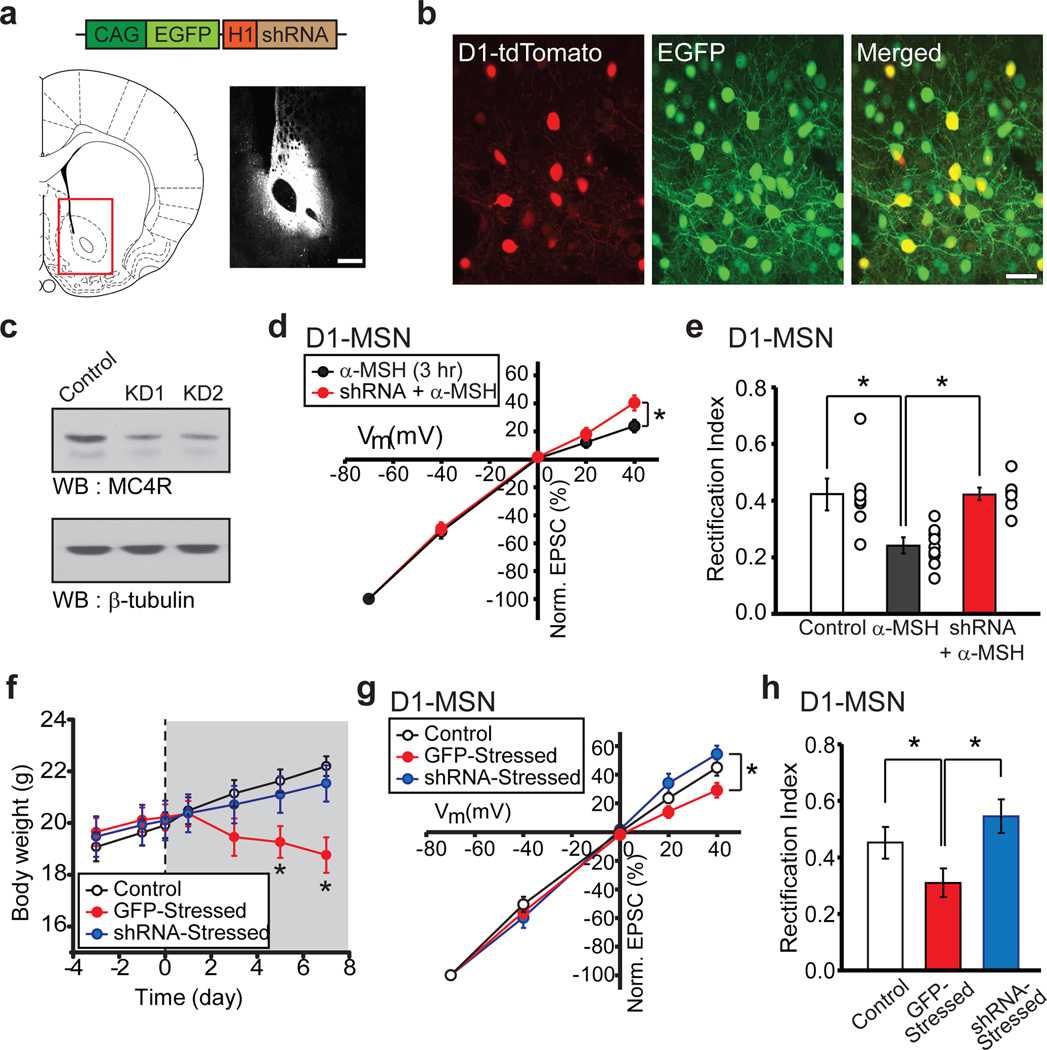
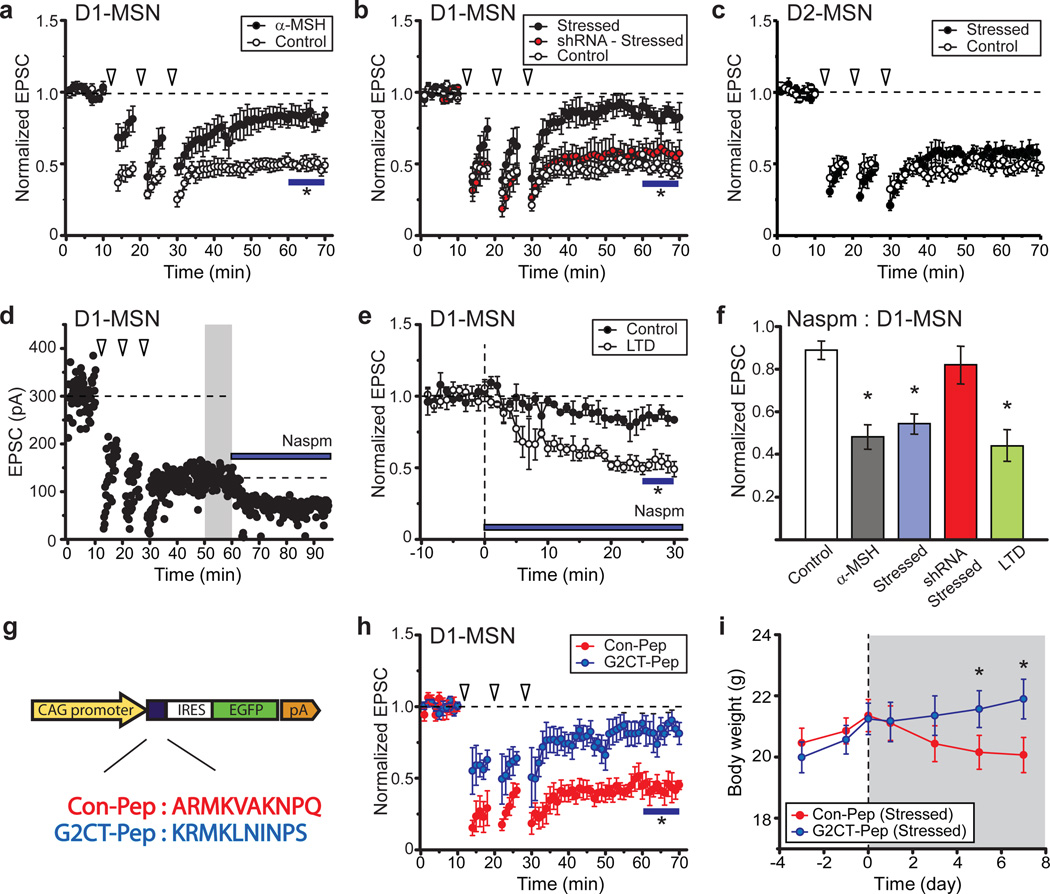
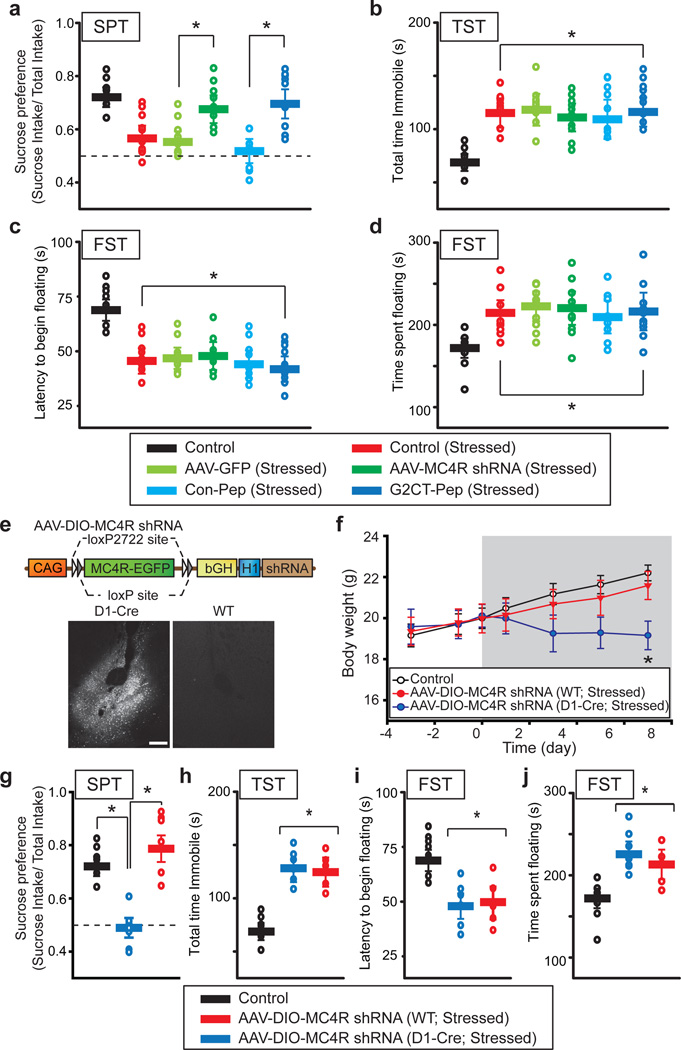
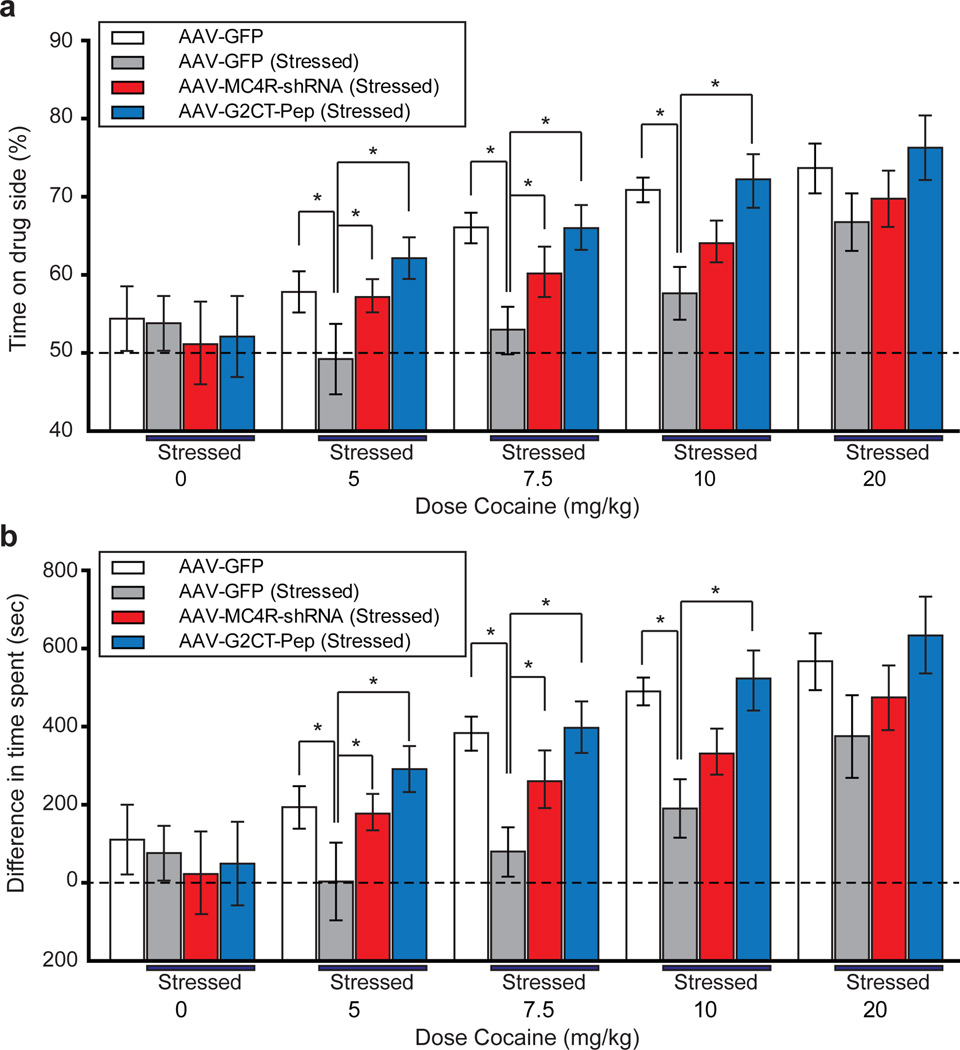
Chronic stress is a strong diathesis for depression in humans and is used to generate animal models of depression. It commonly leads to several major symptoms of depression, including dysregulated feeding behaviour, anhedonia and behavioural despair. Although hypotheses defining the neural pathophysiology of depression have been proposed, the critical synaptic adaptations in key brain circuits that mediate stress-induced depressive symptoms remain poorly understood. Here we show that chronic stress in mice decreases the strength of excitatory synapses on D1 dopamine receptor-expressing nucleus accumbens medium spiny neurons owing to activation of the melanocortin 4 receptor. Stress-elicited increases in behavioural measurements of anhedonia, but not increases in measurements of behavioural despair, are prevented by blocking these melanocortin 4 receptor-mediated synaptic changes in vivo. These results establish that stress-elicited anhedonia requires a neuropeptide-triggered, cell-type-specific synaptic adaptation in the nucleus accumbens and that distinct circuit adaptations mediate other major symptoms of stress-elicited depression.


Figures

Figure 1
Figure 1. α-MSH modifies excitatory synapses on NAc D1-MSNs
a, Image of NAc slice from Drd1a-tdTomato/Drd2-EGFP BAC transgenic mouse (scale bar, 50 µm). b, c, D1-MSN EPSCs at −70 mV and +40 mV (b) and summary (c) of α-MSH effects on AMPAR/NMDAR ratios (Control, 4.16 ± 0.35, n = 7; α-MSH, 2.18 ± 0.29, n = 8; *P < 0.05 Mann-Whitney U-test; error bars are s.e.m. in all figures). Scale bars: 60, 70 pA/100 ms. d, e, EPSCs from D2-MSNs (h) and summary (i) showing no effect of α-MSH (Control, 1.86 ± 0.25, n = 6; α-MSH, 2.12 ± 0.34, n = 5). Scale bars: 90, 100 pA/100 ms. f,g, mEPSCs from control D1-MSN (f) or D1-MSN exposed to α-MSH (g) Scale bars: 20 pA/0.5 s. h, i, Summary of α-MSH effects on mEPSC frequency (h; Control, 5.3 ± 0.4 Hz, n = 9; α-MSH, 5.0 ± 0.7 Hz, n = 11) and amplitude (i; Control, 17.1 ± 0.8 pA; α-MSH, 12.2 ± 1.2 pA; *P < 0.05 Mann-Whitney U-test). j–m, Effects of α-MSH on AMPAR stoichiometry. AMPAR EPSC amplitudes at different membrane potentials (j) (normalized to −70 mV) show α-MSH increases AMPAR EPSC rectification in D1-MSNs (Control, n = 9; α-MSH, n = 12, *P < 0.05 Mann-Whitney U-Test) and enhances effects of Naspm (200 µM) (k, Control: 89 ± 4%, n = 6; α-MSH: 47 ± 9% of baseline 20–25 min after Naspm application, n = 8; *P < 0.05 Mann-Whitney U-Test). In D2-MSNs α-MSH does not affect AMPAR EPSC rectification (l, Control, n = 8; α-MSH, n = 8) nor the Naspm-induced depression (m, Control: 91 ± 5%, n = 6; α-MSH: 90 ± 4%, n = 7).
Figure 2
Figure 2. Chronic restraint stress modifies excitatory synapses on NAc D1-MSNs
a, Coronal sections of dorsal striatum (DS) and NAc (left panel: scale bar, 500 µm) and retrogradely labeled cells in hypothalamus (right panel: ARC, arcuate nucleus; 3V, third ventricle; scale bar, 200 µm) 1 week following injections of RV-EGFP into NAc and RV-tdTomato into DS. b, ARC neurons retrogradely labeled by RV-EGFP injected into the NAc and immunostained for α-MSH (scale bar, 20 µm). c, Body weight of control mice (n =12) and mice subjected to restraint stress (n = 15; *P < 0.05 Mann-Whitney U-Test). d, e, Western blots (d) and quantification (e) showing changes in MC4R levels in NAc during restraint stress (8th day of restraint stress, NAc MC4R levels are 143 ± 14% of control NAc MC4R levels, n = 3, *P < 0.05 Mann-Whitney U-Test). f–i, Effects of restraint stress on AMPAR/NMDAR ratios in D1-MSNs and D2-MSNs. EPSCs at −70 mV and +40 mV from D1-MSNs (f) and summary (g) showing stress-induced decrease in AMPAR/NMDAR ratios (Control, 3.77 ± 0.59, n = 6; Stressed, 2.34 ± 0.36, n = 6; *P < 0.05 Mann-Whitney U-Test). EPSCs (h) and summary (i) of AMPAR/NMDAR ratios from D2-MSNs (Control, 2.03 ± 0.32, n = 5; Stressed, 1.88 ± 0.29, n = 4). Scale bars in f: 80, 100 pA/100 ms. Scale bars in h: 90, 110 pA/100 ms. j–m, Restraint stress changes AMPAR stoichiometry in D1-MSNs but not D2-MSNs. Rectification index of AMPAR EPSCs in D1-MSNs (j) (Control, 0.46 ± 0.04, n = 8; Stressed: 0.29 ± 0.02, n = 10; *P < 0.05 Mann-Whitney U-test). Effect of Naspm (k) on D1-MSN AMPAR EPSCs from stressed animals (65 ± 8%, n= 7; *P < 0.05 Mann-Whitney U-Test). Restraint stress has no effect on D2-MSN AMPAR EPSC rectification (l, m) (Control rectification index, 0.43 ± 0.04, n = 6; Stressed: 0.51 ± 0.09, n = 6; Naspm, sensitivity, 88 ± 11%, n = 6).
Figure 3
Figure 3. Knockdown of NAc MC4Rs prevents stress-induced weight loss and synaptic changes
a, Schematics of AAV vector expressing MC4R shRNA (top) and injection site into NAc core (red box, lower left) with image of EGFP expression in NAc core 2 weeks following injection (lower right; scale bar, 500 µm). b, Magnified images showing EGFP expression in NAc D1-tdTomato MSNs 2 weeks after injection of AAV-MC4R shRNA (scale bar, 20 µm). c, MC4R Western blots from NAc of two animals injected with AAV-MC4R shRNA. d,e, D1-MSN AMPAR EPSC amplitudes at different membrane potentials (d) and rectification index (e, Control: 0.42 ± 0.06, n= 7; α-MSH: 0.24 ± 0.02, n = 9; shRNA + α-MSH: 0.43 ± 0.02, n = 6; *P < 0.05 Mann-Whitney U-Test) demonstrating that in vivo MC4R shRNA prevents the α-MSH-induced change in D1-MSN AMPAR EPSC rectification. f, Stress-induced decrease in body weight is prevented by knockdown of NAc MC4Rs but not by injection of control AAV expressing GFP (Control, n = 12; GFP-Stressed, n = 9; shRNA-Stressed, n = 12; *P < 0.05 Mann-Whitney U-Test). g, h, D1-MSN AMPAR EPSC amplitudes at different membrane potentials (g) and rectification index (h, Control, 0.42 ± 0.06, n = 7 [same as in e]; GFP-Stressed, 0.31 ± 0.05, n = 6; shRNA -Stressed, 0.54 ± 0.08, n = 7; *P < 0.05 Mann-Whitney U-Test) showing that in vivo knockdown of NAc MC4Rs prevents the stress-induced increase in D1-MSN AMPAR EPSC rectification.
Figure 4
Figure 4. Chronic restraint stress induces “LTD” in D1-MSNs
a, Prior exposure to α-MSH reduces NMDAR-dependent LTD in NAc D1-MSNs (Control, 47 ± 4% of baseline 50–60 min after start of induction protocol, n = 7; α-MSH, 82 ± 6%, n = 5; * P < 0.05 Mann-Whitney U-Test) b, LTD in D1-MSNs is reduced by restraint stress (Control, 46 ± 5%, n = 8; Stressed, 84 ± 7%, n = 11; * P < 0.05 Mann-Whitney U-Test) and this decrease is prevented by in vivo knockdown of NAc MC4Rs (shRNA-Stressed, 0.58 ± 9%, n = 7). c, LTD in D2-MSNs is not affected by restraint stress (Control, 49 ± 3%, n = 7; Stressed, 54 ± 5%, n = 6). d, e, Sample experiment (d) and summary (e) showing that following LTD induction, effects of Naspm are increased (Control, 85 ± 5% of baseline, n = 6; 51 ± 4%, n = 4). f, Effects of Naspm on D1-MSN AMPAR EPSCs following various experimental manipulation (* P < 0.05 compared to control, Mann-Whitney U-test) g, Schematic of AAV-vector expressing control peptide (Con-Pep) or peptide blocking GluA2 binding to AP2 (G2CT-Pep). h, LTD in D1-MSNs is reduced by in vivo expression of G2CT-Pep (81 ± 7% of baseline, n = 6) but not Con-pep (47 ± 5%, n = 5; *P < 0.05 Mann-Whitney U-Test). i, Stress-induced decrease in body weight is prevented by expression of G2CT-Pep in NAc (n = 10) but not by Con-Pep expression (n = 9; *P < 0.05 Mann-Whitney U-Test).
Figure 5
Figure 5. MC4R activation and LTD in the NAc are required for stress-induced anhedonia
a, Summary of the sucrose preference test in control mice (n = 9), mice subjected to restraint stress (n = 9) and stressed mice who received NAc injections of AAVs expressing GFP alone (n = 9), MC4R shRNA (n = 10), Con-Pep (n = 8) or G2CT-Pep (n = 10). Expression of either MC4R shRNA or G2CT-Pep in NAc prevented the stress-induced change in this test (* P < 0.05 Mann-Whitney U-Test). b, In the tail suspension tests, these same animals showed a stress-induced increase in time spent immobile (* P < 0.05 Mann-Whitney U-Test compared to Control). c, d, Animals also showed stress-induced changes in the forced swim test measured by latency to the first bout of immobile floating (c) or total duration of immobility/floating (d) (* P < 0.05 Mann-Whitney U-Test compared to Control). e. Diagram of AAV vector used to rescue MC4R in D1-MSNs only. Images of MC4R-EGFP expression following injection of virus into NAc core of D1-Cre mice and wildtype (WT) mice. Scale bar: 250 µm. f. Reversal of stress-induced decrease in body weight by knockdown of NAc MC4Rs was prevented by D1-MSN specific expression of shRNA resistant MC4R (Control, n = 12; AAV-DIO-MC4R shRNA (WT), n = 8; AAV-DIO-MC4R shRNA (D1-Cre), n = 7; *P < 0.05 Mann-Whitney U-Test). g–j. Summary of the sucrose preference test (g), tail suspension test (h) and forced swim test (i–j) in control mice, stressed wild-type and stressed D1-Cre mice. Both groups of stressed mice received NAc injections of AAV-DIO-MC4R shRNAs. D1-MSN specific rescue of MC4Rs reversed the effects of the MC4R shRNA in the sucrose preference test but had no effect on the tail suspension and forced swim tests (* P < 0.05 Mann-Whitney U-Test).
Figure 6
Figure 6. MC4R activation and LTD in the NAc are required for stress-induced decreases in cocaine conditioned place preference (CPP)
a,b. CPP induced by different doses of cocaine in mice that received NAc injection of AAV expressing GFP alone (n = 6), and stressed mice who received NAc injections of AAVs expressing GFP alone (n = 6), MC4R shRNA (n = 7), or G2CT-Pep (n = 6). CPP was measured as percentage of time spent on the cocaine-paired side (a), and the differences between time spent on cocaine-conditioned and saline-conditioned sides (b). Stress reduced CPP at the three lower doses but not the highest dose (20 mg/kg) and this decrease was prevented by expression of MC4R shRNA and G2CT-Pep (* P < 0.05 Mann-Whitney U-Test).

Comment in

References

    1. Cone RD. Anatomy and regulation of the central melanocortin system. Nat. Neurosci. 2005;8:571–578. - PubMed
    1. Gao Q, Horvath TL. Neurobiology of feeding and energy expenditure. Annu. Rev. Neurosci. 2007;30:367–398. - PubMed
    1. Morton GJ, Cummings DE, Baskin DG, Barsh GS, Schwartz MW. Central nervous system control of food intake and body weight. Nature. 2006;443:289–295. - PubMed
    1. Kelley AE, Berridge KC. The neuroscience of natural rewards: relevance to addictive drugs. J. Neurosci. 2002;22:3306–3311. - PMC - PubMed
    1. Volkow ND, Wang GJ, Baler RD. Reward, dopamine and the control of food intake: implications for obesity. Tr. Cogn. Sci. 2011;15:37–46. - PMC - PubMed

Publication types

MeSH terms