. 2012 Jul 12;3(7):e346.
doi: 10.1038/cddis.2012.82.

Induction of robust de novo centrosome amplification, high-grade spindle multipolarity and metaphase catastrophe: a novel chemotherapeutic approach

Affiliations

Induction of robust de novo centrosome amplification, high-grade spindle multipolarity and metaphase catastrophe: a novel chemotherapeutic approach

V Pannu et al. Cell Death Dis. .

Abstract

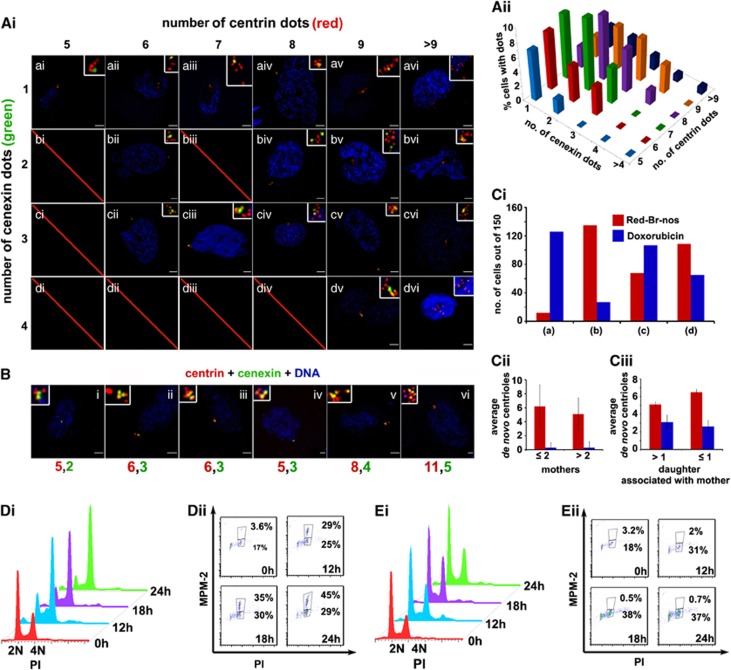
Centrosome amplification (CA) and resultant chromosomal instability have long been associated with tumorigenesis. However, exacerbation of CA and relentless centrosome declustering engender robust spindle multipolarity (SM) during mitosis and may induce cell death. Recently, we demonstrated that a noscapinoid member, reduced bromonoscapine, (S)-3-(R)-9-bromo-5-(4,5-dimethoxy-1,3-dihydroisobenzofuran-1-yl)-4-methoxy-6-methyl-5,6,7,8-tetrahydro-[1,3]dioxolo-[4,5-g]isoquinoline (Red-Br-nos), induces reactive oxygen species (ROS)-mediated autophagy and caspase-independent death in prostate cancer PC-3 cells. Herein, we show that Red-Br-nos induces ROS-dependent DNA damage that resulted in high-grade CA and SM in PC-3 cells. Unlike doxorubicin, which causes double-stranded DNA breaks and chronic G2 arrest accompanied by 'templated' CA, Red-Br-nos-mediated DNA damage elicits de novo CA during a transient S/G2 stall, followed by checkpoint abrogation and mitotic entry to form aberrant mitotic figures with supernumerary spindle poles. Attenuation of multipolar phenotype in the presence of tiron, a ROS inhibitor, indicated that ROS-mediated DNA damage was partly responsible for driving CA and SM. Although a few cells (∼5%) yielded to aberrant cytokinesis following an 'anaphase catastrophe', most mitotically arrested cells (∼70%) succumbed to 'metaphase catastrophe,' which was caspase-independent. This report is the first documentation of rapid de novo centrosome formation in the presence of parent centrosome by a noscapinoid family member, which triggers death-inducing SM via a unique mechanism that distinguishes it from other ROS-inducers, conventional DNA-damaging agents, as well as other microtubule-binding drugs.


Figures

Figure 1
Figure 1
Red-Br-nos triggers ROS-mediated DNA-damage checkpoint response in PC-3 cells. (ai) Representative immunofluorescence confocal micrographs showing emergence of γ-H2AX foci indicative of DNA damage upon treatment with Red-Br-nos (10 μM) over time. Panels show DNA (DAPI), γ-H2AX (green) and MTs (red). (aii and iii) Bar-graph quantitation of number and intensity, respectively, of γ-H2AX foci per cell over time. (b) Immunoblot analysis of γ-H2AX and DNA-damage checkpoint response markers, p-ATR and p-chk1, at the noted time points. β-actin was used as the loading control. (ci) Attenuation of ROS upon a 4-h tiron treatment prior to Red-Br-nos exposure for 12 h showed a marked reduction in the number of cells harboring γ-H2AX foci (green) as compared with drug treatment alone. (cii) Immunoblot showing significant reduction in γ-H2AX expression when tiron was co-treated with drug compared with drug alone. Scale bar=5 μm
Figure 2
Figure 2
Red-Br-nos induces high-grade CA, which is ROS-dependent. (ai and bi) Immunofluorescence confocal micrographs of PC-3 cells treated with vehicle or Red-Br-nos (10 μM) for 12 h. Panels show γ-tubulin or centrin (green), MTs (red) and DNA (DAPI) in control (top row) and Red-Br-nos-treated (bottom row) interphase cells. (aii and bii) Bar-graph quantitation of the number of interphase PC-3 cells harboring the indicated number of γ-tubulin (upper) or centrin (lower) dots upon drug treatment. (c) Confocal immunomicrographs showing vehicle or drug-treated PC-3 cells stained for PLK4 (green), mictrotubules (red) and DNA (blue/DAPI). (d) Immunoblots showing PLK4 expression levels in PC-3 cells treated with 10 μM Red-Br-nos for the indicated times. β-actin was used as the loading control. (e) Immunoblot for phosphohistone-H3 showing increased kinase activity of cdk2 immunoprecipitated from 9-h Red-Br-nos-treated cells. (fi) Attenuation of ROS levels by 4-h tiron treatment followed by drug exposure for 6 and 12 h showed reduction in the incidence of cells harboring multiple centrosomes. γ-tubulin is in green, MTs in red and DNA in blue. (fii) Bar-graph quantitation shown. Scale bar=5 μm
Figure 3
Figure 3
Schematic illustration of three representative cells depicting all the various mother–daughter centriole combinations that were observed upon Red-Br-nos or doxorubicin treatment. Cell I shows two mother centrioles (green), namely M1 and M2, and six daughter centrioles (red). M1 has one closely associated daughter (<0.2 μm) and represents a ‘normal' centrosome or is a result of a normal duplication event. M2 has three daughters lying in close vicinity (∼0.2 μm) representing ‘templated' overduplication. D1 refers to a de novo-formed pair of centrioles, because they are not associated with any mother (> 0.2 μm). Cell II shows two mother centrioles (green) and seven daughter centrioles (red). S1 represents a ‘shared' situation where a single daughter is shared between two mothers. We cannot exclude the possibility that the ‘templated' or de novo-formed centrioles later mature to form mothers. D2 and D3 represent two separate clusters of de novo centrioles separated by a distance of >0.2 μm. Cell III shows three mother centrioles (green) and seven daughter centrioles (red). S2 represents another shared situation where two daughters are shared between two mother centrioles. This situation could arise because of two successive rounds of duplication or may even represent a normal G2 situation. M3 represents a lone mother. D4–D8 represent de novo centrioles lying far apart from each other (>0.2 μm)
Figure 4
Figure 4
Unlike doxorubicin, Red-Br-nos causes de novo centriole formation and mitotic arrest in PC-3 cells. (Ai) Immunofluorescence confocal micrographs showing various permutations of centrin (daughter) and cenexin (mother) dots in Red-Br-nos-treated (10 μM for 18 h) PC-3 cells. Centrin is shown in red, cenexin in green and DNA in blue. (Aii) Three-dimensional bar-graph plot representing the percent cell population with specified patterns of centrin and cenexin dots. (b) Confocal immunomicrographs showing cells with various permutations and combinations of centrin (daughter) and cenexin (mother) dots in doxorubicin-treated (10 μM for 18 h) PC-3 cells. Centrin is shown in red, cenexin in green and DNA in blue. (Ci) Bar graph depicting the outcomes of our database queries on cells treated with either Red-Br-nos (10 μM) or doxorubicin (10 μM) for 18 h. (a), (b), (c) and (d) refer to the database search queries. (a) is the number of cells with an absence of de novo centrioles, (b) represents the number of cells where ratio of daughters to mothers is ≥2, (c) represents cells with ≤2 mothers, signifying cells lacking amplification due to several rounds of duplication and (d) represents cells with at least one mother associated with more than one spatially close daughter. A total of 150 cells were analyzed in each case. (Cii) The output of query (c) that resulted in number of cells with at least one instance of ‘templated' amplification upon multiple rounds of duplication was further analyzed for average number of de novo centrioles as shown in bar graph. (Ciii) The output of query (d) resulted in the number of cells exhibiting ‘templated' duplication that were further analyzed for number of de novo centrioles as plotted in bar graph. (Di and Ei) Three-dimensional DNA histograms representing cell-cycle kinetics of PC-3 cells treated with Red-Br-nos (10 μM) or doxorubicin (10 μM), respectively. The X-axis shows DNA amounts representing different cell-cycle phases, the Y-axis shows the number of cells containing that amount of DNA and the Z-axis shows the duration of treatment. (Dii and Eii) Corresponding dual-color dot plots showing the proportion of mitotic cells (MPM-2-positive) as opposed to G2 cells (MPM-2-negative). Scale bar=5 μm
Figure 5
Figure 5
Red-Br-nos induces high-grade SM in PC-3 cells. (a) Immunofluorescence confocal micrographs of PC-3 cells ‘stuck' in mitosis upon treatment with Red-Br-nos (10 μM) for 18 h. Panels show γ-tubulin in green, MTs in red and DNA in blue (DAPI). (b) Pie-chart quantitation of the proportion of cells exhibiting specified spindle polarity. The category classified as ‘other' predominantly includes bipolar mitotic cells or cells exhibiting aneuploidy and ‘mitotic catastrophe'. (c) ROS inhibition by tiron treatment preceding Red-Br-nos treatment (10 μM) for 24 h showed reduced multipolarity as compared with Red-Br-nos treatment alone. Mictrotubules are shown in red and DNA in blue. (d) PC-3 cells pretreated with cytochalasin D (1 μM) for 4 h and then treated with Red-Br-nos for 18 h showed enhanced spindle-pole amplification as compared with only Red-Br-nos treatment (10 μM) for 18 h. Actin is shown in red, MTs in green and DNA in blue. Scale bar=5 μm
Figure 6
Figure 6
Red-Br-nos activates the SAC and induces ‘metaphase catastrophe'. (a) Immunomicrographs showing PC-3 cells treated with vehicle or Red-Br-nos (10 μM) for 18 h and stained for kinetochores with CREST (red), MTs with α-tubulin (green) and DNA with DAPI (blue). (b) Panels show BuBR1- (green), actin- (red) and DNA- (blue) stained PC-3 cells treated with vehicle (top panel) or Red-Br-nos (lower panel) for 9 h. (c) Immunofluorescence confocal micrographs representing ‘mitotic catastrophe' upon Red-Br-nos treatment at the specified time points. Multipolar cells with membrane blebs or protrusions rich in α-tubulin were indicative of cells dying following an unsuccessful metaphase. γ-tubulin is shown in green, α-tubulin in red and DNA in blue. Scale bar=10 μm
Figure 7
Figure 7
Schematic illustration of a proposed model depicting the progression of events upon induction of high ROS levels by Red-Br-nos. High-grade DNA damage results in transient S/G2 arrest (depicted in yellow/orange) followed by a chronic mitotic arrest (depicted in red). Accumulation of S-phase-specific cyclins/cdks results in accrual of PCM components in the vicinity of an already existing and ‘ready to duplicate' centrosome. CA, predominantly de novo centriole formation along with some degree of ‘templated' overduplication, occurs during the transient S/G2 arrest, which then translates into excessively multipolar phenotypes during a stalled mitosis. Majority of the arrested multipolar cells succumb to ‘metaphase catastrophe' due to the chaos arising from multiple insults the cells have suffered including irreparable DNA damage, aberrant kinetochore-MT attachments and spindle multipolarity

Similar articles

Cited by

References

    1. Lingle WL, Lukasiewicz K, Salisbury JL. Deregulation of the centrosome cycle and the origin of chromosomal instability in cancer. Adv Exp Med Biol. 2005;570:393–421. - PubMed
    1. Holland AJ, Cleveland DW. Boveri revisited: chromosomal instability, aneuploidy and tumorigenesis. Nat Rev Mol Cell Biol. 2009;10:478–487. - PMC - PubMed
    1. Brinkley BR. Managing the centrosome numbers game: from chaos to stability in cancer cell division. Trends Cell Biol. 2001;11:18–21. - PubMed
    1. Quintyne NJ, Reing JE, Hoffelder DR, Gollin SM, Saunders WS. Spindle multipolarity is prevented by centrosomal clustering. Science. 2005;307:127–129. - PubMed
    1. Ganem NJ, Godinho SA, Pellman D. A mechanism linking extra centrosomes to chromosomal instability. Nature. 2009;460:278–282. - PMC - PubMed

Publication types

Substances