

Data mining in the Life Sciences with Random Forest: a walk in the park or lost in the jungle?
- PMID: 22786785
- PMCID: PMC3659301
- DOI: 10.1093/bib/bbs034
Data mining in the Life Sciences with Random Forest: a walk in the park or lost in the jungle?
Abstract
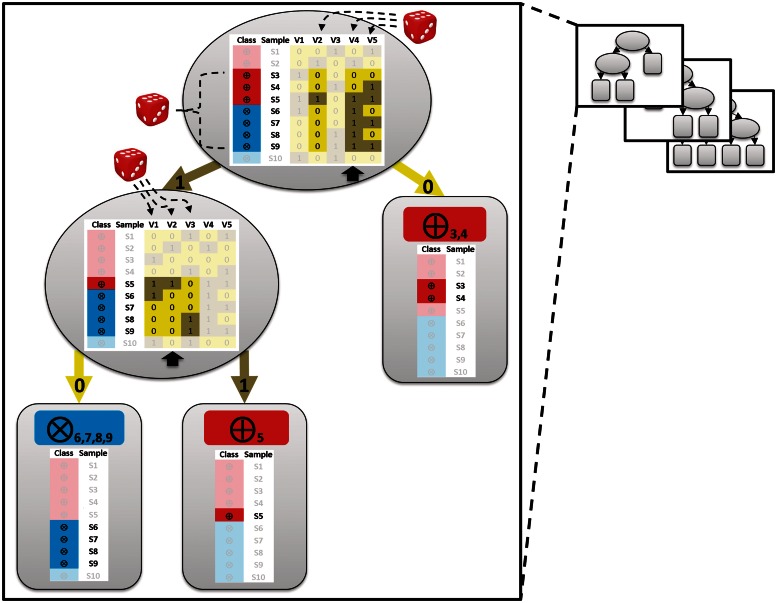
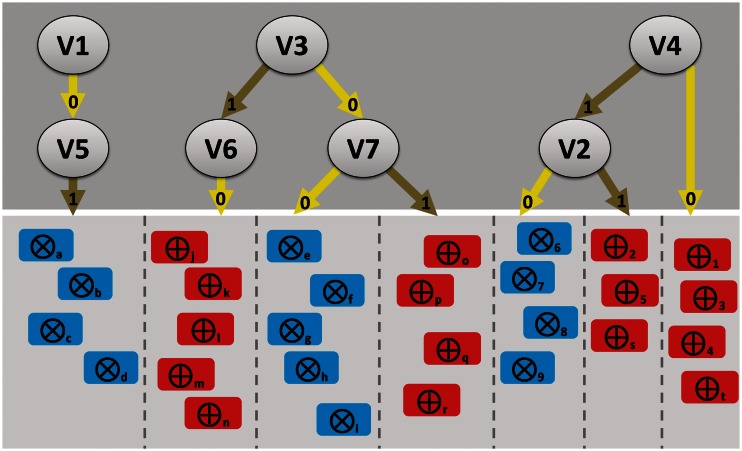
In the Life Sciences 'omics' data is increasingly generated by different high-throughput technologies. Often only the integration of these data allows uncovering biological insights that can be experimentally validated or mechanistically modelled, i.e. sophisticated computational approaches are required to extract the complex non-linear trends present in omics data. Classification techniques allow training a model based on variables (e.g. SNPs in genetic association studies) to separate different classes (e.g. healthy subjects versus patients). Random Forest (RF) is a versatile classification algorithm suited for the analysis of these large data sets. In the Life Sciences, RF is popular because RF classification models have a high-prediction accuracy and provide information on importance of variables for classification. For omics data, variables or conditional relations between variables are typically important for a subset of samples of the same class. For example: within a class of cancer patients certain SNP combinations may be important for a subset of patients that have a specific subtype of cancer, but not important for a different subset of patients. These conditional relationships can in principle be uncovered from the data with RF as these are implicitly taken into account by the algorithm during the creation of the classification model. This review details some of the to the best of our knowledge rarely or never used RF properties that allow maximizing the biological insights that can be extracted from complex omics data sets using RF.
Keywords: Random Forest; conditional relationships; local importance; proximity; variable importance; variable interaction.
Figures
Comment in
-
Letter to the Editor: On the term 'interaction' and related phrases in the literature on Random Forests.Brief Bioinform. 2015 Mar;16(2):338-45. doi: 10.1093/bib/bbu012. Epub 2014 Apr 9. Brief Bioinform. 2015. PMID: 24723569 Free PMC article.
References
-
- Ideker T, Galitski T, Hood L. A new approach to decoding life: systems biology. Annu Rev Genomics Hum Genet. 2001;2:343–72. - PubMed
-
- Kitano H. Systems biology: a brief overview. Science. 2002;295:1662–4. - PubMed
-
- Ghosh S, Matsuoka Y, Asai Y, et al. Software for systems biology: from tools to integrated platforms. Nat Rev Genet. 2011;12:821–32. - PubMed
-
- Gehlenborg N, O’Donoghue SI, Baliga NS, et al. Visualization of omics data for systems biology. Nat Methods. 2010;7:S56–68. - PubMed
MeSH terms
LinkOut - more resources
Full Text Sources
Other Literature Sources
