

Genome-wide methylation profiling in decitabine-treated patients with acute myeloid leukemia
- PMID: 22786882
- PMCID: PMC3448258
- DOI: 10.1182/blood-2012-05-429175
Genome-wide methylation profiling in decitabine-treated patients with acute myeloid leukemia
Abstract
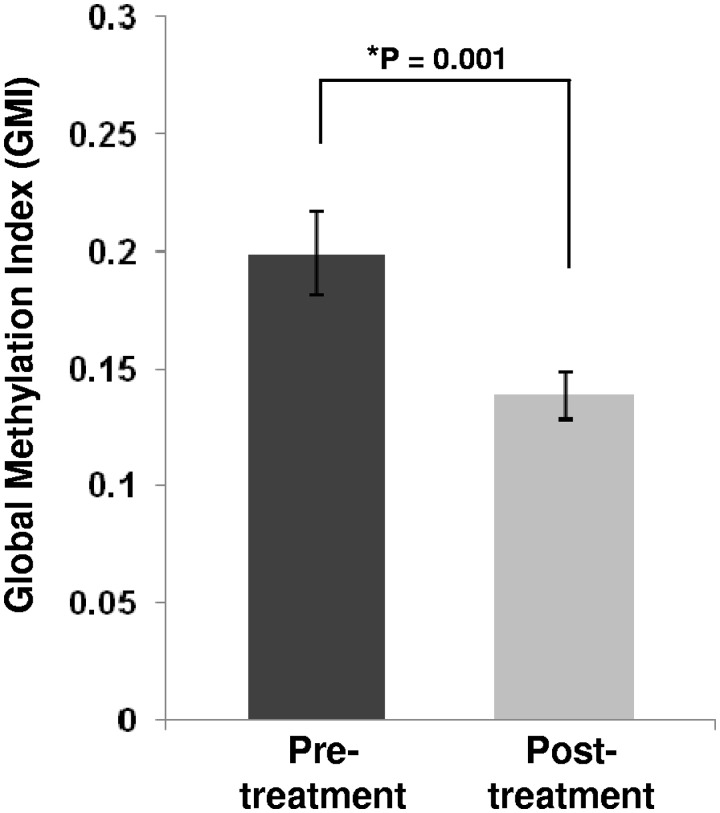
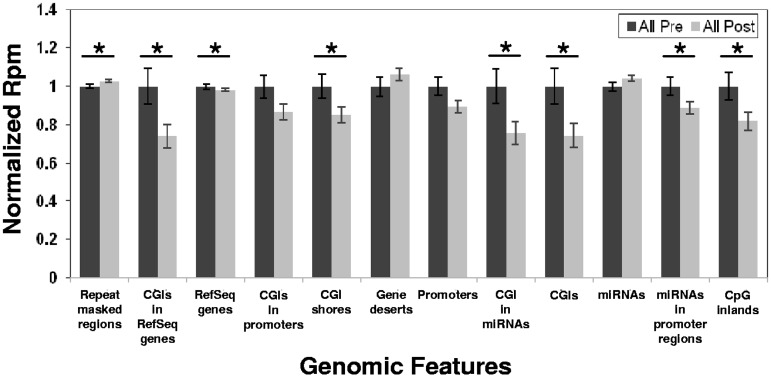
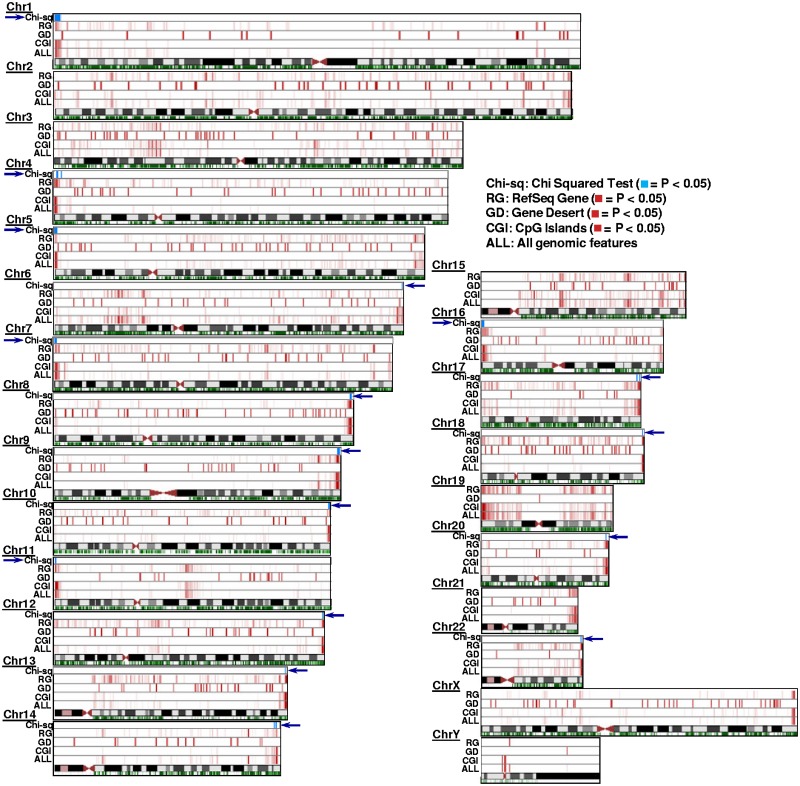
The outcome of older (≥ 60 years) acute myeloid leukemia (AML) patients is poor, and novel treatments are needed. In a phase 2 trial for older AML patients, low-dose (20 mg/m(2) per day for 10 days) decitabine, a DNA hypomethylating azanucleoside, produced 47% complete response rate with an excellent toxicity profile. To assess the genome-wide activity of decitabine, we profiled pretreatment and post treatment (day 25/course 1) methylomes of marrow samples from patients (n = 16) participating in the trial using deep-sequencing analysis of methylated DNA captured by methyl-binding protein (MBD2). Decitabine significantly reduced global methylation compared with pretreatment baseline (P = .001). Percent marrow blasts did not correlate with global methylation levels, suggesting that hypomethylation was related to the activity of decitabine rather than to a mere decrease in leukemia burden. Hypomethylation occurred predominantly in CpG islands and CpG island-associated regions (P ranged from .03 to .04) A significant concentration (P < .001) of the hypomehtylated CpG islands was found in chromosome subtelomeric regions, suggesting a differential activity of decitabine in distinct chromosome regions. Hypermethylation occurred much less frequently than hypomethylation and was associated with low CpG content regions. Decitabine-related methylation changes were concordant with those previously reported in distinct genes. In summary, our study supports the feasibility of methylome analyses as a pharmacodynamic endpoint for hypomethylating therapies.
Figures
Comment in
-
Cp-jeez! Aza-natomy!Blood. 2012 Sep 20;120(12):2354-5. doi: 10.1182/blood-2012-08-443952. Blood. 2012. PMID: 22996655
References
-
- Estey E. AML in older patients: are we making progress? Best Pract Res Clin Haematol. 2009;22(4):529–536. - PubMed
-
- Dombret H. Gene mutation and AML pathogenesis. Blood. 2011;118(20):5366–5367. - PubMed
-
- Roboz GJ. Novel approaches to the treatment of acute myeloid leukemia. Hematology Am Soc Hematol Educ Program. 2011;2011:43–50. - PubMed
-
- Kaiser J. Epigenetic drugs take on cancer. Science. 2010;330:576–578. - PubMed
Publication types
MeSH terms
Substances
Grants and funding
LinkOut - more resources
Full Text Sources
Other Literature Sources
Medical
Miscellaneous
