. 2012 Jul 24;109(30):11944-8.
doi: 10.1073/pnas.1204664109. Epub 2012 Jul 11.

Bedrock displacements in Greenland manifest ice mass variations, climate cycles and climate change

Affiliations

Bedrock displacements in Greenland manifest ice mass variations, climate cycles and climate change

Michael Bevis et al. Proc Natl Acad Sci U S A. .

Abstract

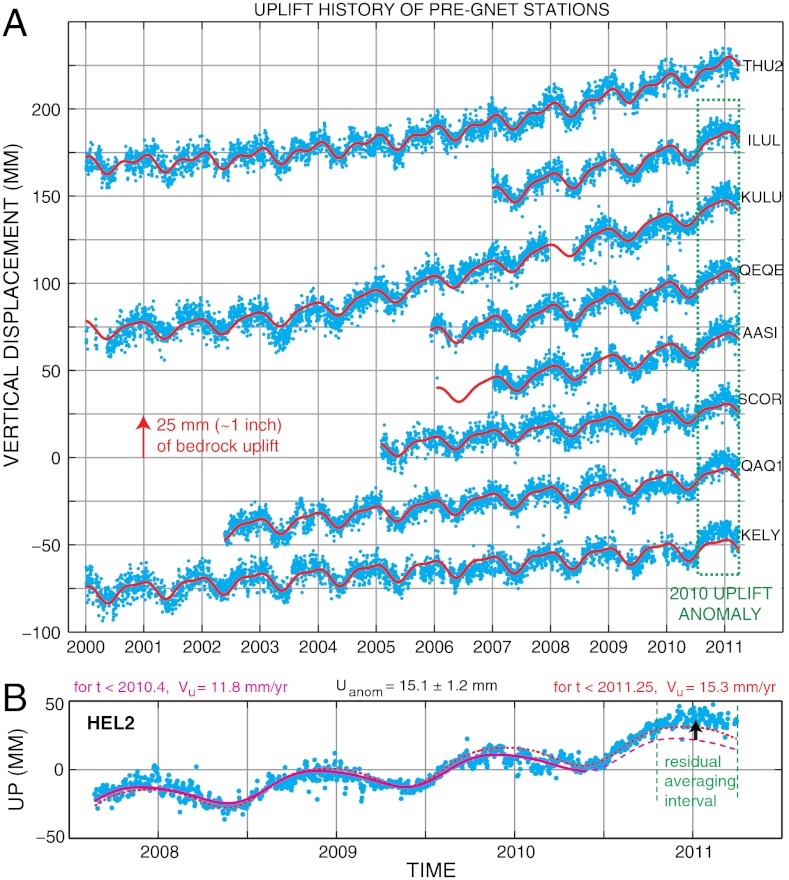
The Greenland GPS Network (GNET) uses the Global Positioning System (GPS) to measure the displacement of bedrock exposed near the margins of the Greenland ice sheet. The entire network is uplifting in response to past and present-day changes in ice mass. Crustal displacement is largely accounted for by an annual oscillation superimposed on a sustained trend. The oscillation is driven by earth's elastic response to seasonal variations in ice mass and air mass (i.e., atmospheric pressure). Observed vertical velocities are higher and often much higher than predicted rates of postglacial rebound (PGR), implying that uplift is usually dominated by the solid earth's instantaneous elastic response to contemporary losses in ice mass rather than PGR. Superimposed on longer-term trends, an anomalous 'pulse' of uplift accumulated at many GNET stations during an approximate six-month period in 2010. This anomalous uplift is spatially correlated with the 2010 melting day anomaly.


Conflict of interest statement

The authors declare no conflict of interest.

Figures

Fig. 1.
Fig. 1.
Observed vertical velocities (in mm/yr) of the GNET stations in southeast Greenland. These velocities, their uncertainties (< 1 mm/yr), and the observational time spans are listed in SI Appendix, Table S1. When a station’s velocity estimate is known to have been very strongly affected by the 2010 ice loss anomaly (as at station SENU), the velocity label is marked *. However, there is no way to know the extent to which the 2010 anomaly has affected the GNET stations established in 2009. Some of the longer-lived GPS stations such as KULU have recorded major changes in uplift rate throughout their lifetimes, in which case their average vertical velocity since the beginning of year 2000 is given, and this velocity is marked with a V to indicate multiyear variability. Note that station symbols encode their installation dates. The highest uplift rates observed so far anywhere in Greenland are those at stations MIK2 and KUAQ; however, it seems likely that these rates were perturbed upwards by the 2010 melting anomaly, and do not represent the average uplift rates over the several years prior to 2010.
Fig. 2.
Fig. 2.
Observed vertical velocities in west and northwest Greenland. Symbols and related information are explained in the caption to Fig. 1. Note that, in a given section of the coastal region, station velocity tends to increase as distance to the ice margin decreases. One sigma standard errors are nearly always < 1 mm/yr (SI Appendix, Table S1).
Fig. 3.
Fig. 3.
Observed vertical velocities in north and northeast Greenland. Symbols and related information are explained in the caption to Fig. 1. Here, as in Figs. 1 and 2, if the four-letter station code appears in grey it means that a velocity solution is not yet available because technical problems led to a total observational timespan of less than one year. The standard error estimates for velocity vary with the timespan of observation (SI Appendix, Table S1) but are nearly always < 1 mm/yr.
Fig. 4.
Fig. 4.
(A) Vertical displacement time series at selected older GPS stations (blue dots) and model trajectory (red) curves composed of an annual oscillation plus a multiyear trend. The trend model is linear in time except at stations THU2 and KULU, where it is a second- and third-order polynomial, respectively. Note that for every station shown except THU2, the model curve systematically underestimates the observations obtained after approximately 2010.4. (B) The vertical displacement times series U(t) (blue dots) at HEL2. A trajectory model fit to U(t) for t < 2010.40 (solid magenta line) is projected to the end of the time series at 2011.25 (dashed magenta line). The 2010 uplift anomaly is defined as the mean difference between the U(t) and this projected curve during the time interval 2010.8–2011.25. This anomaly (15.2 ± 12 mm) is indicated by the black arrow. The velocity of the trend established prior to 2010.4 is 11.8 mm/yr. But if a trajectory model is fit to all U(t)—i.e., for t < 2011.25 (red dotted curve)—then the velocity changes to 15.3 mm/yr.
Fig. 5.
Fig. 5.
The 2010 uplift anomaly (green arrows) for all GPS stations in Greenland where it could be reliably computed, superimposed on a map showing the 2010 melting day anomaly that was produced by R. Simmon at the NASA Earth Observatory using data provided by M. Tedesco (13). When we take into account the tendency for the earth’s elastic response to ice loss to decrease with distance from the unloading area (i.e., the ice margin), then the spatial correlation between the uplift anomaly and the melting day anomaly is apparent. The standard errors associated with the 2010 uplift anomaly estimates are listed in SI Appendix, Table S2. They are typically close to approximately 1.75 mm.
Fig. 6.
Fig. 6.
A comparison of crustal displacement and surface loading cycles in Greenland. We plot the down (D) rather than up (U) component of displacement to aid the comparison with load cycles, since the ground moves down as the load increases. The seasonal cycles of the air mass and ice mass (overlying Greenland as a whole) are shown, as is their sum, which far better correlates with the displacement cycle.

References

    1. Hager B. Weighing the ice sheets using space geodesy: A way to measure changes in ice sheet mass. Eos. Trans. AGU. 1991;72(Spring Meeting Suppl):71.
    1. Velicogna I, Wahr J. Measurements of time-variable gravity show mass loss in Antarctica. Science. 2006;311:1754–1756. - PubMed
    1. Bevis M, et al. Geodetic measurements of vertical crustal velocity in West Antarctica and the implications for ice mass balance. Geochem Geophys Geosyst. 2009 10.1029/Q1005. - DOI
    1. Tapley BD, Bettadpur S, Ries J, Thompson PF, Watkins MM. GRACE measurements of mass variability in the Earth system. Science. 2004;305:503–505. - PubMed
    1. Le Meur E, Huybrechts P. A model computation of the temporal changes of surface gravity and geoidal signal induced by the evolving Greenland ice sheet. Geophys J Int. 2001;145:835–849.

Publication types