Review
. 2012 Jul-Aug;32(4):947-69.
doi: 10.1148/rg.324105181.

Radiofrequency ablation of lung tumors: imaging features of the postablation zone

Affiliations
Review

Radiofrequency ablation of lung tumors: imaging features of the postablation zone

Fereidoun G Abtin et al. Radiographics. 2012 Jul-Aug.

Abstract

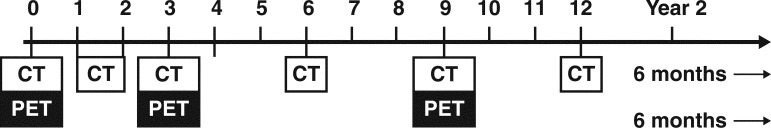
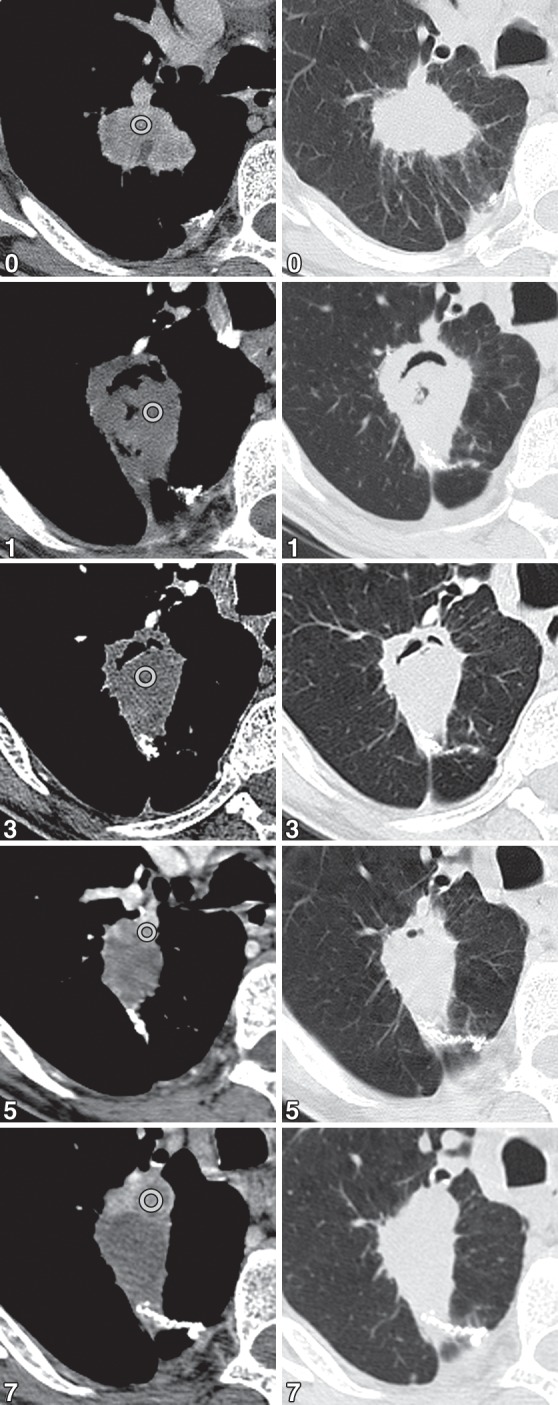
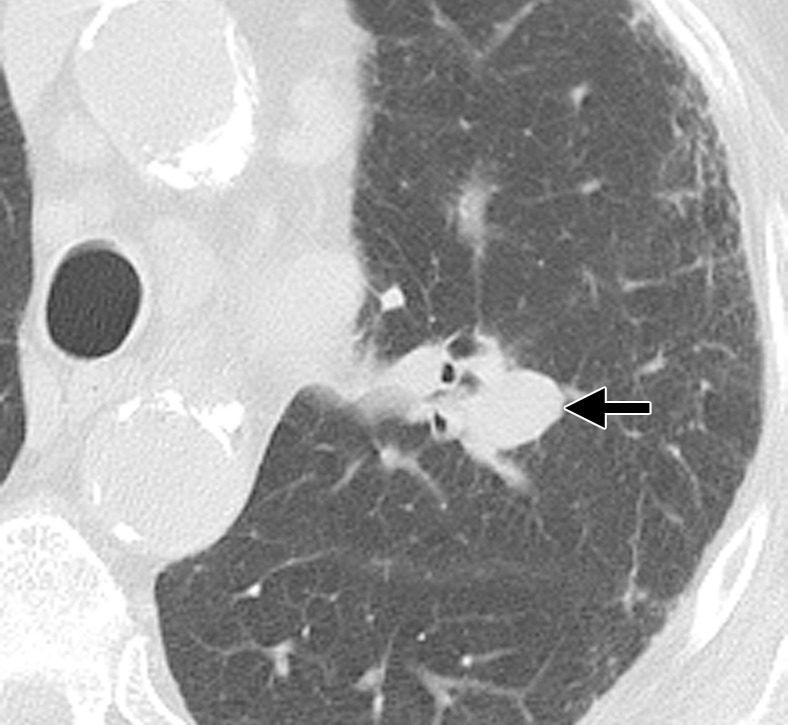
Radiofrequency ablation (RFA) is used to treat pulmonary malignancies. Although preliminary results are suggestive of a survival benefit, local progression rates are appreciable. Because a patient can undergo repeat treatment if recurrence is detected early, reliable post-RFA imaging follow-up is critical. The purpose of this article is to describe (a) an algorithm for post-RFA imaging surveillance; (b) the computed tomographic (CT) appearance, size, enhancement, and positron emission tomographic (PET) metabolic activity of the ablation zone; and (c) CT, PET, and dual-modality imaging with PET and CT (PET/CT) features suggestive of partial ablation or tumor recurrence and progression. CT is routinely used for post-RFA follow-up. PET and PET/CT have emerged as auxiliary follow-up techniques. CT with nodule densitometry may be used to supplement standard CT. Post-RFA follow-up was divided into three phases: early (immediately after to 1 week after RFA), intermediate (>1 week to 2 months), and late (>2 months). CT and PET imaging features suggestive of residual or recurrent disease include (a) increasing contrast material uptake in the ablation zone (>180 seconds on dynamic images), nodular enhancement measuring more than 10 mm, any central enhancement greater than 15 HU, and enhancement greater than baseline anytime after ablation; (b) growth of the RFA zone after 3 months (compared with baseline) and definitely after 6 months, peripheral nodular growth and change from ground-glass opacity to solid opacity, regional or distant lymph node enlargement, and new intrathoracic or extrathoracic disease; and (c) increased metabolic activity beyond 2 months, residual activity centrally or at the ablated tumor, and development of nodular activity.


Figures

Figure 1a
Figure 1a
CT nodule densitometry at 3-month follow-up after ablation of a left lingular metastasis from colorectal carcinoma in a 62-year-old man. (a) CT images obtained at the level of ablation show that the nodule is close to the lingular bronchus and artery. Left to right: Preinjection unenhanced CT image (0 seconds) is followed by contrast-enhanced CT images obtained at 45, 90, 180, and 300 seconds after contrast material injection, which demonstrate enhancement of the residual tumor. Region of interest markers (circles) on the images are placed at the same location and should avoid partial inclusion of vessels or airway. (b) Graph of enhancement in relation to time after contrast material administration charts the enhancement pattern. Enhancement of more than 15 HU is considered evidence for recurrence.
Figure 1b
Figure 1b
CT nodule densitometry at 3-month follow-up after ablation of a left lingular metastasis from colorectal carcinoma in a 62-year-old man. (a) CT images obtained at the level of ablation show that the nodule is close to the lingular bronchus and artery. Left to right: Preinjection unenhanced CT image (0 seconds) is followed by contrast-enhanced CT images obtained at 45, 90, 180, and 300 seconds after contrast material injection, which demonstrate enhancement of the residual tumor. Region of interest markers (circles) on the images are placed at the same location and should avoid partial inclusion of vessels or airway. (b) Graph of enhancement in relation to time after contrast material administration charts the enhancement pattern. Enhancement of more than 15 HU is considered evidence for recurrence.
Figure 2a
Figure 2a
Fused PET/CT images of a left suprahilar non–small cell lung carcinoma in a 68-year-old woman. (a) Preablation image demonstrates a mean SUV of 7.7 in the region of interest (circle). (b) Image obtained after ablation shows a drop in SUV centrally, but there is an area of high SUV measuring 1.6 at the medial periphery, a finding that is suggestive of residual tumor and inadequate ablation.
Figure 2b
Figure 2b
Fused PET/CT images of a left suprahilar non–small cell lung carcinoma in a 68-year-old woman. (a) Preablation image demonstrates a mean SUV of 7.7 in the region of interest (circle). (b) Image obtained after ablation shows a drop in SUV centrally, but there is an area of high SUV measuring 1.6 at the medial periphery, a finding that is suggestive of residual tumor and inadequate ablation.
Figure 3
Figure 3
Diagram showing PET/CT (black and white boxes together) incorporated into the follow-up imaging protocol after RFA (numbers = months after RFA). Initial PET/CT is required for staging. Thereafter, whole-body CT with CT nodule densitometry (white box alone) through the ablation zone is performed at 1–2 months. PET/CT is performed at 3 months and thereafter every 6 months (alternating with CT alone performed every 6 months) until 2 years after RFA.
Figure 4a
Figure 4a
Metastatic ependymoma in a 58-year-old man undergoing RFA with a single probe. (a) CT image obtained at completion of the ablation cycle shows increased attenuation around the probe and the lesion, a finding referred to as the lightbulb sign (arrows). (b) CT image obtained immediately after ablation and removal of the probe shows an area of cone-shaped sectorial hyperemia (arrowheads), a finding that corresponds to the safety zone, the area of ablation beyond the margins of the tumor.
Figure 4b
Figure 4b
Metastatic ependymoma in a 58-year-old man undergoing RFA with a single probe. (a) CT image obtained at completion of the ablation cycle shows increased attenuation around the probe and the lesion, a finding referred to as the lightbulb sign (arrows). (b) CT image obtained immediately after ablation and removal of the probe shows an area of cone-shaped sectorial hyperemia (arrowheads), a finding that corresponds to the safety zone, the area of ablation beyond the margins of the tumor.
Figure 5a
Figure 5a
Heat sink effect and inadequate ablation of a metastatic nodule from a renal cell carcinoma in the right lower lobe in a 57-year-old man. (a) CT image shows the solitary 19 × 18-mm metastatic nodule in the right lower lobe. (b) Coronal CT reconstruction after placement of a single RFA probe within the center of the nodule shows a relatively large pulmonary segmental artery (arrow) adjacent to the lateral margin of the tumor. (c) Coronal CT reconstruction after two cycles of complete ablation with final temperatures higher than 60°C shows an adequate ablation zone and ground-glass opacity extending beyond 5 mm from the margins of the nodule, with the exception of the lateral margin bordering the pulmonary artery branch (arrow), a finding that is due to the heat sink effect. (d) Contrast-enhanced CT image obtained at 3 months after RFA shows peripheral nodular enhancement (arrowhead) adjacent to the pulmonary artery branch. (e) CT image obtained at 9 months shows that the nodule has grown larger than baseline and larger than the 3-month postablation zone, a finding consistent with recurrence. (f) Axial PET image obtained at 9 months shows hypermetabolic activity, which is also consistent with recurrence.
Figure 5b
Figure 5b
Heat sink effect and inadequate ablation of a metastatic nodule from a renal cell carcinoma in the right lower lobe in a 57-year-old man. (a) CT image shows the solitary 19 × 18-mm metastatic nodule in the right lower lobe. (b) Coronal CT reconstruction after placement of a single RFA probe within the center of the nodule shows a relatively large pulmonary segmental artery (arrow) adjacent to the lateral margin of the tumor. (c) Coronal CT reconstruction after two cycles of complete ablation with final temperatures higher than 60°C shows an adequate ablation zone and ground-glass opacity extending beyond 5 mm from the margins of the nodule, with the exception of the lateral margin bordering the pulmonary artery branch (arrow), a finding that is due to the heat sink effect. (d) Contrast-enhanced CT image obtained at 3 months after RFA shows peripheral nodular enhancement (arrowhead) adjacent to the pulmonary artery branch. (e) CT image obtained at 9 months shows that the nodule has grown larger than baseline and larger than the 3-month postablation zone, a finding consistent with recurrence. (f) Axial PET image obtained at 9 months shows hypermetabolic activity, which is also consistent with recurrence.
Figure 5c
Figure 5c
Heat sink effect and inadequate ablation of a metastatic nodule from a renal cell carcinoma in the right lower lobe in a 57-year-old man. (a) CT image shows the solitary 19 × 18-mm metastatic nodule in the right lower lobe. (b) Coronal CT reconstruction after placement of a single RFA probe within the center of the nodule shows a relatively large pulmonary segmental artery (arrow) adjacent to the lateral margin of the tumor. (c) Coronal CT reconstruction after two cycles of complete ablation with final temperatures higher than 60°C shows an adequate ablation zone and ground-glass opacity extending beyond 5 mm from the margins of the nodule, with the exception of the lateral margin bordering the pulmonary artery branch (arrow), a finding that is due to the heat sink effect. (d) Contrast-enhanced CT image obtained at 3 months after RFA shows peripheral nodular enhancement (arrowhead) adjacent to the pulmonary artery branch. (e) CT image obtained at 9 months shows that the nodule has grown larger than baseline and larger than the 3-month postablation zone, a finding consistent with recurrence. (f) Axial PET image obtained at 9 months shows hypermetabolic activity, which is also consistent with recurrence.
Figure 5d
Figure 5d
Heat sink effect and inadequate ablation of a metastatic nodule from a renal cell carcinoma in the right lower lobe in a 57-year-old man. (a) CT image shows the solitary 19 × 18-mm metastatic nodule in the right lower lobe. (b) Coronal CT reconstruction after placement of a single RFA probe within the center of the nodule shows a relatively large pulmonary segmental artery (arrow) adjacent to the lateral margin of the tumor. (c) Coronal CT reconstruction after two cycles of complete ablation with final temperatures higher than 60°C shows an adequate ablation zone and ground-glass opacity extending beyond 5 mm from the margins of the nodule, with the exception of the lateral margin bordering the pulmonary artery branch (arrow), a finding that is due to the heat sink effect. (d) Contrast-enhanced CT image obtained at 3 months after RFA shows peripheral nodular enhancement (arrowhead) adjacent to the pulmonary artery branch. (e) CT image obtained at 9 months shows that the nodule has grown larger than baseline and larger than the 3-month postablation zone, a finding consistent with recurrence. (f) Axial PET image obtained at 9 months shows hypermetabolic activity, which is also consistent with recurrence.
Figure 5e
Figure 5e
Heat sink effect and inadequate ablation of a metastatic nodule from a renal cell carcinoma in the right lower lobe in a 57-year-old man. (a) CT image shows the solitary 19 × 18-mm metastatic nodule in the right lower lobe. (b) Coronal CT reconstruction after placement of a single RFA probe within the center of the nodule shows a relatively large pulmonary segmental artery (arrow) adjacent to the lateral margin of the tumor. (c) Coronal CT reconstruction after two cycles of complete ablation with final temperatures higher than 60°C shows an adequate ablation zone and ground-glass opacity extending beyond 5 mm from the margins of the nodule, with the exception of the lateral margin bordering the pulmonary artery branch (arrow), a finding that is due to the heat sink effect. (d) Contrast-enhanced CT image obtained at 3 months after RFA shows peripheral nodular enhancement (arrowhead) adjacent to the pulmonary artery branch. (e) CT image obtained at 9 months shows that the nodule has grown larger than baseline and larger than the 3-month postablation zone, a finding consistent with recurrence. (f) Axial PET image obtained at 9 months shows hypermetabolic activity, which is also consistent with recurrence.
Figure 5f
Figure 5f
Heat sink effect and inadequate ablation of a metastatic nodule from a renal cell carcinoma in the right lower lobe in a 57-year-old man. (a) CT image shows the solitary 19 × 18-mm metastatic nodule in the right lower lobe. (b) Coronal CT reconstruction after placement of a single RFA probe within the center of the nodule shows a relatively large pulmonary segmental artery (arrow) adjacent to the lateral margin of the tumor. (c) Coronal CT reconstruction after two cycles of complete ablation with final temperatures higher than 60°C shows an adequate ablation zone and ground-glass opacity extending beyond 5 mm from the margins of the nodule, with the exception of the lateral margin bordering the pulmonary artery branch (arrow), a finding that is due to the heat sink effect. (d) Contrast-enhanced CT image obtained at 3 months after RFA shows peripheral nodular enhancement (arrowhead) adjacent to the pulmonary artery branch. (e) CT image obtained at 9 months shows that the nodule has grown larger than baseline and larger than the 3-month postablation zone, a finding consistent with recurrence. (f) Axial PET image obtained at 9 months shows hypermetabolic activity, which is also consistent with recurrence.
Figure 6a
Figure 6a
Images from a porcine model of RFA. (a) Photomicrograph (original magnification, ×40; hematoxylin-eosin [H-E] stain) of a histologic section of an ablated lesion in a porcine lung shows normal lung tissue (N), congestion (C) in the outermost layer, and effusion (E) in the lumina of the pulmonary alveoli in the intermediate layer. (b) Photomicrograph (original magnification, ×20; NADH diaphorase stain) of the same section of tissue as in a shows that the intermediate layer (E) shown in a does not stain with NADH and conforms to the ablated lesion, which has undergone coagulation necrosis. However, the outermost layer (C) contains an admixture of stained and unstained cells (arrows). NL = normal lung tissue. (Reprinted, with permission, from reference .)
Figure 6b
Figure 6b
Images from a porcine model of RFA. (a) Photomicrograph (original magnification, ×40; hematoxylin-eosin [H-E] stain) of a histologic section of an ablated lesion in a porcine lung shows normal lung tissue (N), congestion (C) in the outermost layer, and effusion (E) in the lumina of the pulmonary alveoli in the intermediate layer. (b) Photomicrograph (original magnification, ×20; NADH diaphorase stain) of the same section of tissue as in a shows that the intermediate layer (E) shown in a does not stain with NADH and conforms to the ablated lesion, which has undergone coagulation necrosis. However, the outermost layer (C) contains an admixture of stained and unstained cells (arrows). NL = normal lung tissue. (Reprinted, with permission, from reference .)
Figure 7
Figure 7
Cockade phenomenon in a 65-year-old man after RFA. CT image of the post-RFA ablation zone demonstrates multiple concentric layers. Zones A and B are not distinguished separately and correspond to the enlarged primary lesion; these two zones histologically correspond to vacuolation and charred tissue (zone A) and coagulated tumor (zone B). Zone C is a rim of relatively low-attenuation ground-glass opacity immediately around the tumor (black arrows), which histologically corresponds to coagulated pulmonary parenchyma. Zone D is the higher-attenuation ground-glass opacity (arrowheads), which histologically corresponds to coagulation necrosis mixed with hemorrhage. Zone E is the variable ground-glass opacity (white arrows), which histologically represents peripheral inflammatory reaction.
Figure 8a
Figure 8a
Metastatic pulmonary lesion from colon carcinoma in a 71-year-old man undergoing RFA with a single probe. (a) Contrast-enhanced CT image obtained immediately after ablation shows a cone-shaped sectorial hyperemia (arrowheads), which corresponds to the safety zone, the area of ablation beyond lesion margins. Hypoattenuating bubbles and pleural retraction are seen. (b, c) CT images obtained with lung (b) and soft-tissue (c) windows at 1 week show that the ablation zone has increased compared with the original due to a combination of consolidation, inflammation, and hemorrhage. Cavitation and hypoattenuating bubbles are common at this stage. (d) At 1 week, images of CT nodule densitometry obtained at 45, 90, 180, and 300 seconds after contrast material injection show a thin rim of enhancement (arrow) without central nodularity or contrast enhancement of more than 15 HU. (e, f) CT (e) and fused PET/CT (f) images obtained at 18 months show a residual scar without metabolic activity.
Figure 8b
Figure 8b
Metastatic pulmonary lesion from colon carcinoma in a 71-year-old man undergoing RFA with a single probe. (a) Contrast-enhanced CT image obtained immediately after ablation shows a cone-shaped sectorial hyperemia (arrowheads), which corresponds to the safety zone, the area of ablation beyond lesion margins. Hypoattenuating bubbles and pleural retraction are seen. (b, c) CT images obtained with lung (b) and soft-tissue (c) windows at 1 week show that the ablation zone has increased compared with the original due to a combination of consolidation, inflammation, and hemorrhage. Cavitation and hypoattenuating bubbles are common at this stage. (d) At 1 week, images of CT nodule densitometry obtained at 45, 90, 180, and 300 seconds after contrast material injection show a thin rim of enhancement (arrow) without central nodularity or contrast enhancement of more than 15 HU. (e, f) CT (e) and fused PET/CT (f) images obtained at 18 months show a residual scar without metabolic activity.
Figure 8c
Figure 8c
Metastatic pulmonary lesion from colon carcinoma in a 71-year-old man undergoing RFA with a single probe. (a) Contrast-enhanced CT image obtained immediately after ablation shows a cone-shaped sectorial hyperemia (arrowheads), which corresponds to the safety zone, the area of ablation beyond lesion margins. Hypoattenuating bubbles and pleural retraction are seen. (b, c) CT images obtained with lung (b) and soft-tissue (c) windows at 1 week show that the ablation zone has increased compared with the original due to a combination of consolidation, inflammation, and hemorrhage. Cavitation and hypoattenuating bubbles are common at this stage. (d) At 1 week, images of CT nodule densitometry obtained at 45, 90, 180, and 300 seconds after contrast material injection show a thin rim of enhancement (arrow) without central nodularity or contrast enhancement of more than 15 HU. (e, f) CT (e) and fused PET/CT (f) images obtained at 18 months show a residual scar without metabolic activity.
Figure 8d
Figure 8d
Metastatic pulmonary lesion from colon carcinoma in a 71-year-old man undergoing RFA with a single probe. (a) Contrast-enhanced CT image obtained immediately after ablation shows a cone-shaped sectorial hyperemia (arrowheads), which corresponds to the safety zone, the area of ablation beyond lesion margins. Hypoattenuating bubbles and pleural retraction are seen. (b, c) CT images obtained with lung (b) and soft-tissue (c) windows at 1 week show that the ablation zone has increased compared with the original due to a combination of consolidation, inflammation, and hemorrhage. Cavitation and hypoattenuating bubbles are common at this stage. (d) At 1 week, images of CT nodule densitometry obtained at 45, 90, 180, and 300 seconds after contrast material injection show a thin rim of enhancement (arrow) without central nodularity or contrast enhancement of more than 15 HU. (e, f) CT (e) and fused PET/CT (f) images obtained at 18 months show a residual scar without metabolic activity.
Figure 8e
Figure 8e
Metastatic pulmonary lesion from colon carcinoma in a 71-year-old man undergoing RFA with a single probe. (a) Contrast-enhanced CT image obtained immediately after ablation shows a cone-shaped sectorial hyperemia (arrowheads), which corresponds to the safety zone, the area of ablation beyond lesion margins. Hypoattenuating bubbles and pleural retraction are seen. (b, c) CT images obtained with lung (b) and soft-tissue (c) windows at 1 week show that the ablation zone has increased compared with the original due to a combination of consolidation, inflammation, and hemorrhage. Cavitation and hypoattenuating bubbles are common at this stage. (d) At 1 week, images of CT nodule densitometry obtained at 45, 90, 180, and 300 seconds after contrast material injection show a thin rim of enhancement (arrow) without central nodularity or contrast enhancement of more than 15 HU. (e, f) CT (e) and fused PET/CT (f) images obtained at 18 months show a residual scar without metabolic activity.
Figure 8f
Figure 8f
Metastatic pulmonary lesion from colon carcinoma in a 71-year-old man undergoing RFA with a single probe. (a) Contrast-enhanced CT image obtained immediately after ablation shows a cone-shaped sectorial hyperemia (arrowheads), which corresponds to the safety zone, the area of ablation beyond lesion margins. Hypoattenuating bubbles and pleural retraction are seen. (b, c) CT images obtained with lung (b) and soft-tissue (c) windows at 1 week show that the ablation zone has increased compared with the original due to a combination of consolidation, inflammation, and hemorrhage. Cavitation and hypoattenuating bubbles are common at this stage. (d) At 1 week, images of CT nodule densitometry obtained at 45, 90, 180, and 300 seconds after contrast material injection show a thin rim of enhancement (arrow) without central nodularity or contrast enhancement of more than 15 HU. (e, f) CT (e) and fused PET/CT (f) images obtained at 18 months show a residual scar without metabolic activity.
Figure 9a
Figure 9a
Renal cell carcinoma with metastasis to the left lower lobe in a 64-year-old man. (a) CT image shows the pulmonary metastatic lesion. (b) CT image obtained immediately after ablation shows postablation zones C (arrows) and D (arrowheads) around the tumor, corresponding to the safety zone, the area of ablation beyond the tumor margins. (c) CT image obtained at 1 month after ablation shows a larger ablation zone than the original tumor, but the surrounding ground-glass opacity and hemorrhage have involuted. Cavitation and hypoattenuating bubbles are common at this stage. Pleural thickening is depicted adjacent to the ablation zone and along the electrode track. (d) CT image obtained at 4 months after ablation shows that the ablation zone continues to demonstrate peripheral enhancement (arrows). Pleural effusion and atelectasis were also seen secondary to ablation of another nodule in the left upper lobe (not shown). (e) Axial fused PET/CT image shows peripheral FDG uptake (arrows) not exceeding that of the blood pool or the adjacent collapsed lung. (f–h) Follow-up CT images obtained at 6 months (f), 9 months (g), and 12 months (h) after ablation. The nodule continues to regress in size, measuring smaller than the original tumor, with eventual scarring and remodeling of lung parenchyma and resolution of the pleural thickening and effusion.
Figure 9b
Figure 9b
Renal cell carcinoma with metastasis to the left lower lobe in a 64-year-old man. (a) CT image shows the pulmonary metastatic lesion. (b) CT image obtained immediately after ablation shows postablation zones C (arrows) and D (arrowheads) around the tumor, corresponding to the safety zone, the area of ablation beyond the tumor margins. (c) CT image obtained at 1 month after ablation shows a larger ablation zone than the original tumor, but the surrounding ground-glass opacity and hemorrhage have involuted. Cavitation and hypoattenuating bubbles are common at this stage. Pleural thickening is depicted adjacent to the ablation zone and along the electrode track. (d) CT image obtained at 4 months after ablation shows that the ablation zone continues to demonstrate peripheral enhancement (arrows). Pleural effusion and atelectasis were also seen secondary to ablation of another nodule in the left upper lobe (not shown). (e) Axial fused PET/CT image shows peripheral FDG uptake (arrows) not exceeding that of the blood pool or the adjacent collapsed lung. (f–h) Follow-up CT images obtained at 6 months (f), 9 months (g), and 12 months (h) after ablation. The nodule continues to regress in size, measuring smaller than the original tumor, with eventual scarring and remodeling of lung parenchyma and resolution of the pleural thickening and effusion.
Figure 9c
Figure 9c
Renal cell carcinoma with metastasis to the left lower lobe in a 64-year-old man. (a) CT image shows the pulmonary metastatic lesion. (b) CT image obtained immediately after ablation shows postablation zones C (arrows) and D (arrowheads) around the tumor, corresponding to the safety zone, the area of ablation beyond the tumor margins. (c) CT image obtained at 1 month after ablation shows a larger ablation zone than the original tumor, but the surrounding ground-glass opacity and hemorrhage have involuted. Cavitation and hypoattenuating bubbles are common at this stage. Pleural thickening is depicted adjacent to the ablation zone and along the electrode track. (d) CT image obtained at 4 months after ablation shows that the ablation zone continues to demonstrate peripheral enhancement (arrows). Pleural effusion and atelectasis were also seen secondary to ablation of another nodule in the left upper lobe (not shown). (e) Axial fused PET/CT image shows peripheral FDG uptake (arrows) not exceeding that of the blood pool or the adjacent collapsed lung. (f–h) Follow-up CT images obtained at 6 months (f), 9 months (g), and 12 months (h) after ablation. The nodule continues to regress in size, measuring smaller than the original tumor, with eventual scarring and remodeling of lung parenchyma and resolution of the pleural thickening and effusion.
Figure 9d
Figure 9d
Renal cell carcinoma with metastasis to the left lower lobe in a 64-year-old man. (a) CT image shows the pulmonary metastatic lesion. (b) CT image obtained immediately after ablation shows postablation zones C (arrows) and D (arrowheads) around the tumor, corresponding to the safety zone, the area of ablation beyond the tumor margins. (c) CT image obtained at 1 month after ablation shows a larger ablation zone than the original tumor, but the surrounding ground-glass opacity and hemorrhage have involuted. Cavitation and hypoattenuating bubbles are common at this stage. Pleural thickening is depicted adjacent to the ablation zone and along the electrode track. (d) CT image obtained at 4 months after ablation shows that the ablation zone continues to demonstrate peripheral enhancement (arrows). Pleural effusion and atelectasis were also seen secondary to ablation of another nodule in the left upper lobe (not shown). (e) Axial fused PET/CT image shows peripheral FDG uptake (arrows) not exceeding that of the blood pool or the adjacent collapsed lung. (f–h) Follow-up CT images obtained at 6 months (f), 9 months (g), and 12 months (h) after ablation. The nodule continues to regress in size, measuring smaller than the original tumor, with eventual scarring and remodeling of lung parenchyma and resolution of the pleural thickening and effusion.
Figure 9e
Figure 9e
Renal cell carcinoma with metastasis to the left lower lobe in a 64-year-old man. (a) CT image shows the pulmonary metastatic lesion. (b) CT image obtained immediately after ablation shows postablation zones C (arrows) and D (arrowheads) around the tumor, corresponding to the safety zone, the area of ablation beyond the tumor margins. (c) CT image obtained at 1 month after ablation shows a larger ablation zone than the original tumor, but the surrounding ground-glass opacity and hemorrhage have involuted. Cavitation and hypoattenuating bubbles are common at this stage. Pleural thickening is depicted adjacent to the ablation zone and along the electrode track. (d) CT image obtained at 4 months after ablation shows that the ablation zone continues to demonstrate peripheral enhancement (arrows). Pleural effusion and atelectasis were also seen secondary to ablation of another nodule in the left upper lobe (not shown). (e) Axial fused PET/CT image shows peripheral FDG uptake (arrows) not exceeding that of the blood pool or the adjacent collapsed lung. (f–h) Follow-up CT images obtained at 6 months (f), 9 months (g), and 12 months (h) after ablation. The nodule continues to regress in size, measuring smaller than the original tumor, with eventual scarring and remodeling of lung parenchyma and resolution of the pleural thickening and effusion.
Figure 9f
Figure 9f
Renal cell carcinoma with metastasis to the left lower lobe in a 64-year-old man. (a) CT image shows the pulmonary metastatic lesion. (b) CT image obtained immediately after ablation shows postablation zones C (arrows) and D (arrowheads) around the tumor, corresponding to the safety zone, the area of ablation beyond the tumor margins. (c) CT image obtained at 1 month after ablation shows a larger ablation zone than the original tumor, but the surrounding ground-glass opacity and hemorrhage have involuted. Cavitation and hypoattenuating bubbles are common at this stage. Pleural thickening is depicted adjacent to the ablation zone and along the electrode track. (d) CT image obtained at 4 months after ablation shows that the ablation zone continues to demonstrate peripheral enhancement (arrows). Pleural effusion and atelectasis were also seen secondary to ablation of another nodule in the left upper lobe (not shown). (e) Axial fused PET/CT image shows peripheral FDG uptake (arrows) not exceeding that of the blood pool or the adjacent collapsed lung. (f–h) Follow-up CT images obtained at 6 months (f), 9 months (g), and 12 months (h) after ablation. The nodule continues to regress in size, measuring smaller than the original tumor, with eventual scarring and remodeling of lung parenchyma and resolution of the pleural thickening and effusion.
Figure 9g
Figure 9g
Renal cell carcinoma with metastasis to the left lower lobe in a 64-year-old man. (a) CT image shows the pulmonary metastatic lesion. (b) CT image obtained immediately after ablation shows postablation zones C (arrows) and D (arrowheads) around the tumor, corresponding to the safety zone, the area of ablation beyond the tumor margins. (c) CT image obtained at 1 month after ablation shows a larger ablation zone than the original tumor, but the surrounding ground-glass opacity and hemorrhage have involuted. Cavitation and hypoattenuating bubbles are common at this stage. Pleural thickening is depicted adjacent to the ablation zone and along the electrode track. (d) CT image obtained at 4 months after ablation shows that the ablation zone continues to demonstrate peripheral enhancement (arrows). Pleural effusion and atelectasis were also seen secondary to ablation of another nodule in the left upper lobe (not shown). (e) Axial fused PET/CT image shows peripheral FDG uptake (arrows) not exceeding that of the blood pool or the adjacent collapsed lung. (f–h) Follow-up CT images obtained at 6 months (f), 9 months (g), and 12 months (h) after ablation. The nodule continues to regress in size, measuring smaller than the original tumor, with eventual scarring and remodeling of lung parenchyma and resolution of the pleural thickening and effusion.
Figure 9h
Figure 9h
Renal cell carcinoma with metastasis to the left lower lobe in a 64-year-old man. (a) CT image shows the pulmonary metastatic lesion. (b) CT image obtained immediately after ablation shows postablation zones C (arrows) and D (arrowheads) around the tumor, corresponding to the safety zone, the area of ablation beyond the tumor margins. (c) CT image obtained at 1 month after ablation shows a larger ablation zone than the original tumor, but the surrounding ground-glass opacity and hemorrhage have involuted. Cavitation and hypoattenuating bubbles are common at this stage. Pleural thickening is depicted adjacent to the ablation zone and along the electrode track. (d) CT image obtained at 4 months after ablation shows that the ablation zone continues to demonstrate peripheral enhancement (arrows). Pleural effusion and atelectasis were also seen secondary to ablation of another nodule in the left upper lobe (not shown). (e) Axial fused PET/CT image shows peripheral FDG uptake (arrows) not exceeding that of the blood pool or the adjacent collapsed lung. (f–h) Follow-up CT images obtained at 6 months (f), 9 months (g), and 12 months (h) after ablation. The nodule continues to regress in size, measuring smaller than the original tumor, with eventual scarring and remodeling of lung parenchyma and resolution of the pleural thickening and effusion.
Figure 10a
Figure 10a
Colon carcinoma with metastasis to the left lower lobe in a 62-year-old man. (a) CT image shows the pulmonary lesion with surrounding satellite nodules and extension up to the pleural surface. After removal of one of the electrodes, a breach at the pleural surface (arrow) is seen. On the postablation chest radiograph (not shown), there was no appreciable pneumothorax, and the patient was discharged. On postablation day 10, the patient presented with persistent shortness of breath. (b) CT image obtained on day 10 shows a breach in the pleural surface (arrow), surrounded by the postablation zone. A chest tube was inserted. (c) Subsequent chest radiograph shows the chest tube, with reexpansion of the lung. The tube remained in place for 11 days. On postablation day 21, after multiple attempts, the chest tube was clamped for 12 hours and subsequently removed. (d) Chest radiograph obtained after removal of the tube shows no redevelopment of pneumothorax.
Figure 10b
Figure 10b
Colon carcinoma with metastasis to the left lower lobe in a 62-year-old man. (a) CT image shows the pulmonary lesion with surrounding satellite nodules and extension up to the pleural surface. After removal of one of the electrodes, a breach at the pleural surface (arrow) is seen. On the postablation chest radiograph (not shown), there was no appreciable pneumothorax, and the patient was discharged. On postablation day 10, the patient presented with persistent shortness of breath. (b) CT image obtained on day 10 shows a breach in the pleural surface (arrow), surrounded by the postablation zone. A chest tube was inserted. (c) Subsequent chest radiograph shows the chest tube, with reexpansion of the lung. The tube remained in place for 11 days. On postablation day 21, after multiple attempts, the chest tube was clamped for 12 hours and subsequently removed. (d) Chest radiograph obtained after removal of the tube shows no redevelopment of pneumothorax.
Figure 10c
Figure 10c
Colon carcinoma with metastasis to the left lower lobe in a 62-year-old man. (a) CT image shows the pulmonary lesion with surrounding satellite nodules and extension up to the pleural surface. After removal of one of the electrodes, a breach at the pleural surface (arrow) is seen. On the postablation chest radiograph (not shown), there was no appreciable pneumothorax, and the patient was discharged. On postablation day 10, the patient presented with persistent shortness of breath. (b) CT image obtained on day 10 shows a breach in the pleural surface (arrow), surrounded by the postablation zone. A chest tube was inserted. (c) Subsequent chest radiograph shows the chest tube, with reexpansion of the lung. The tube remained in place for 11 days. On postablation day 21, after multiple attempts, the chest tube was clamped for 12 hours and subsequently removed. (d) Chest radiograph obtained after removal of the tube shows no redevelopment of pneumothorax.
Figure 10d
Figure 10d
Colon carcinoma with metastasis to the left lower lobe in a 62-year-old man. (a) CT image shows the pulmonary lesion with surrounding satellite nodules and extension up to the pleural surface. After removal of one of the electrodes, a breach at the pleural surface (arrow) is seen. On the postablation chest radiograph (not shown), there was no appreciable pneumothorax, and the patient was discharged. On postablation day 10, the patient presented with persistent shortness of breath. (b) CT image obtained on day 10 shows a breach in the pleural surface (arrow), surrounded by the postablation zone. A chest tube was inserted. (c) Subsequent chest radiograph shows the chest tube, with reexpansion of the lung. The tube remained in place for 11 days. On postablation day 21, after multiple attempts, the chest tube was clamped for 12 hours and subsequently removed. (d) Chest radiograph obtained after removal of the tube shows no redevelopment of pneumothorax.
Figure 11a
Figure 11a
Non–small cell lung carcinoma in the right upper lobe in a 71-year-old woman. (a) CT image obtained with the patient in the prone position shows the lesion in the right upper lobe. (b) CT image obtained at RFA shows the single electrode with its tines deployed, extending to the edge of the mass. (c) Contrast-enhanced CT image at 3-month follow-up shows that there is overall stability in the size of the ablation zone without central nodular enhancement, with the exception of a focal peripheral enhancing nodular lesion (arrows). (d) Unenhanced CT image (lung window) shows needle biopsy of the nodule being performed. (e) The findings from the lung core-needle biopsy were negative for recurrence, but the photomicrograph (original magnification, ×100; H-E stain) of a histologic section of the specimen from biopsy shows fibrin (F) and collagen (C) deposition, with neovascularization (arrows = new vessels).
Figure 11b
Figure 11b
Non–small cell lung carcinoma in the right upper lobe in a 71-year-old woman. (a) CT image obtained with the patient in the prone position shows the lesion in the right upper lobe. (b) CT image obtained at RFA shows the single electrode with its tines deployed, extending to the edge of the mass. (c) Contrast-enhanced CT image at 3-month follow-up shows that there is overall stability in the size of the ablation zone without central nodular enhancement, with the exception of a focal peripheral enhancing nodular lesion (arrows). (d) Unenhanced CT image (lung window) shows needle biopsy of the nodule being performed. (e) The findings from the lung core-needle biopsy were negative for recurrence, but the photomicrograph (original magnification, ×100; H-E stain) of a histologic section of the specimen from biopsy shows fibrin (F) and collagen (C) deposition, with neovascularization (arrows = new vessels).
Figure 11c
Figure 11c
Non–small cell lung carcinoma in the right upper lobe in a 71-year-old woman. (a) CT image obtained with the patient in the prone position shows the lesion in the right upper lobe. (b) CT image obtained at RFA shows the single electrode with its tines deployed, extending to the edge of the mass. (c) Contrast-enhanced CT image at 3-month follow-up shows that there is overall stability in the size of the ablation zone without central nodular enhancement, with the exception of a focal peripheral enhancing nodular lesion (arrows). (d) Unenhanced CT image (lung window) shows needle biopsy of the nodule being performed. (e) The findings from the lung core-needle biopsy were negative for recurrence, but the photomicrograph (original magnification, ×100; H-E stain) of a histologic section of the specimen from biopsy shows fibrin (F) and collagen (C) deposition, with neovascularization (arrows = new vessels).
Figure 11d
Figure 11d
Non–small cell lung carcinoma in the right upper lobe in a 71-year-old woman. (a) CT image obtained with the patient in the prone position shows the lesion in the right upper lobe. (b) CT image obtained at RFA shows the single electrode with its tines deployed, extending to the edge of the mass. (c) Contrast-enhanced CT image at 3-month follow-up shows that there is overall stability in the size of the ablation zone without central nodular enhancement, with the exception of a focal peripheral enhancing nodular lesion (arrows). (d) Unenhanced CT image (lung window) shows needle biopsy of the nodule being performed. (e) The findings from the lung core-needle biopsy were negative for recurrence, but the photomicrograph (original magnification, ×100; H-E stain) of a histologic section of the specimen from biopsy shows fibrin (F) and collagen (C) deposition, with neovascularization (arrows = new vessels).
Figure 11e
Figure 11e
Non–small cell lung carcinoma in the right upper lobe in a 71-year-old woman. (a) CT image obtained with the patient in the prone position shows the lesion in the right upper lobe. (b) CT image obtained at RFA shows the single electrode with its tines deployed, extending to the edge of the mass. (c) Contrast-enhanced CT image at 3-month follow-up shows that there is overall stability in the size of the ablation zone without central nodular enhancement, with the exception of a focal peripheral enhancing nodular lesion (arrows). (d) Unenhanced CT image (lung window) shows needle biopsy of the nodule being performed. (e) The findings from the lung core-needle biopsy were negative for recurrence, but the photomicrograph (original magnification, ×100; H-E stain) of a histologic section of the specimen from biopsy shows fibrin (F) and collagen (C) deposition, with neovascularization (arrows = new vessels).
Figure 12a
Figure 12a
Primary lung adenocarcinoma in a 75-year-old man undergoing RFA with two electrodes. (a) CT image (lung window) shows the right lower lobe mass. (b) CT image (lung window) shows an electrode through the tumor after ablation. Small periablational hemorrhage and mild retraction of the pleura are depicted. (c) CT image obtained at 3-month follow-up shows an enlarging nodule (arrows) at the medial periphery of the ablation zone, a finding that instigated a lung core-needle biopsy. (d) CT image shows biopsy needle. (e) Photomicrograph (original magnification, ×400; H-E stain) of a histologic section of the specimen from biopsy shows nests of neoplastic cells (arrows) within a dense collagenous (C) desmoplastic response. Inset: Photomicrograph (original magnification, ×400; immunohistochemical stain for thyroid transcription factor 1 [TTF-1]) of a histologic section of the specimen from biopsy shows that the neoplastic cells (arrowheads) are positive for TTF-1 (brown nuclear staining), a finding that helped confirm their pulmonary origin.
Figure 12b
Figure 12b
Primary lung adenocarcinoma in a 75-year-old man undergoing RFA with two electrodes. (a) CT image (lung window) shows the right lower lobe mass. (b) CT image (lung window) shows an electrode through the tumor after ablation. Small periablational hemorrhage and mild retraction of the pleura are depicted. (c) CT image obtained at 3-month follow-up shows an enlarging nodule (arrows) at the medial periphery of the ablation zone, a finding that instigated a lung core-needle biopsy. (d) CT image shows biopsy needle. (e) Photomicrograph (original magnification, ×400; H-E stain) of a histologic section of the specimen from biopsy shows nests of neoplastic cells (arrows) within a dense collagenous (C) desmoplastic response. Inset: Photomicrograph (original magnification, ×400; immunohistochemical stain for thyroid transcription factor 1 [TTF-1]) of a histologic section of the specimen from biopsy shows that the neoplastic cells (arrowheads) are positive for TTF-1 (brown nuclear staining), a finding that helped confirm their pulmonary origin.
Figure 12c
Figure 12c
Primary lung adenocarcinoma in a 75-year-old man undergoing RFA with two electrodes. (a) CT image (lung window) shows the right lower lobe mass. (b) CT image (lung window) shows an electrode through the tumor after ablation. Small periablational hemorrhage and mild retraction of the pleura are depicted. (c) CT image obtained at 3-month follow-up shows an enlarging nodule (arrows) at the medial periphery of the ablation zone, a finding that instigated a lung core-needle biopsy. (d) CT image shows biopsy needle. (e) Photomicrograph (original magnification, ×400; H-E stain) of a histologic section of the specimen from biopsy shows nests of neoplastic cells (arrows) within a dense collagenous (C) desmoplastic response. Inset: Photomicrograph (original magnification, ×400; immunohistochemical stain for thyroid transcription factor 1 [TTF-1]) of a histologic section of the specimen from biopsy shows that the neoplastic cells (arrowheads) are positive for TTF-1 (brown nuclear staining), a finding that helped confirm their pulmonary origin.
Figure 12d
Figure 12d
Primary lung adenocarcinoma in a 75-year-old man undergoing RFA with two electrodes. (a) CT image (lung window) shows the right lower lobe mass. (b) CT image (lung window) shows an electrode through the tumor after ablation. Small periablational hemorrhage and mild retraction of the pleura are depicted. (c) CT image obtained at 3-month follow-up shows an enlarging nodule (arrows) at the medial periphery of the ablation zone, a finding that instigated a lung core-needle biopsy. (d) CT image shows biopsy needle. (e) Photomicrograph (original magnification, ×400; H-E stain) of a histologic section of the specimen from biopsy shows nests of neoplastic cells (arrows) within a dense collagenous (C) desmoplastic response. Inset: Photomicrograph (original magnification, ×400; immunohistochemical stain for thyroid transcription factor 1 [TTF-1]) of a histologic section of the specimen from biopsy shows that the neoplastic cells (arrowheads) are positive for TTF-1 (brown nuclear staining), a finding that helped confirm their pulmonary origin.
Figure 12e
Figure 12e
Primary lung adenocarcinoma in a 75-year-old man undergoing RFA with two electrodes. (a) CT image (lung window) shows the right lower lobe mass. (b) CT image (lung window) shows an electrode through the tumor after ablation. Small periablational hemorrhage and mild retraction of the pleura are depicted. (c) CT image obtained at 3-month follow-up shows an enlarging nodule (arrows) at the medial periphery of the ablation zone, a finding that instigated a lung core-needle biopsy. (d) CT image shows biopsy needle. (e) Photomicrograph (original magnification, ×400; H-E stain) of a histologic section of the specimen from biopsy shows nests of neoplastic cells (arrows) within a dense collagenous (C) desmoplastic response. Inset: Photomicrograph (original magnification, ×400; immunohistochemical stain for thyroid transcription factor 1 [TTF-1]) of a histologic section of the specimen from biopsy shows that the neoplastic cells (arrowheads) are positive for TTF-1 (brown nuclear staining), a finding that helped confirm their pulmonary origin.
Figures 13a
Figures 13a
No recurrence after RFA in a 67-year-old man. (a) Composite series of CT images show the enhancement pattern (left row) and the change in size (right row) with time (numbers = months after RFA). (b) Graph shows the relationship of lesion size and enhancement during the 12-month post-RFA period. The numbers along the red line represent the maximum enhancement before and after contrast material administration, and the numbers along the blue line represent the size of the tumor (before RFA) or the ablation zone. The contrast enhancement (red line) decreases immediately after ablation and remains below baseline, never exceeding 15 HU. A slight increase in enhancement, compared with the 1-month value, occurs by 6 months, but then enhancement continues to decrease until 12 months. After RFA, the postablation zone (blue line) is largest up to1 month after RFA and then decreases in size thereafter but remains larger than the original size until 3 months; after 3 months, the zone continues to decrease in size and remains smaller than the original size.
Figures 13b
Figures 13b
No recurrence after RFA in a 67-year-old man. (a) Composite series of CT images show the enhancement pattern (left row) and the change in size (right row) with time (numbers = months after RFA). (b) Graph shows the relationship of lesion size and enhancement during the 12-month post-RFA period. The numbers along the red line represent the maximum enhancement before and after contrast material administration, and the numbers along the blue line represent the size of the tumor (before RFA) or the ablation zone. The contrast enhancement (red line) decreases immediately after ablation and remains below baseline, never exceeding 15 HU. A slight increase in enhancement, compared with the 1-month value, occurs by 6 months, but then enhancement continues to decrease until 12 months. After RFA, the postablation zone (blue line) is largest up to1 month after RFA and then decreases in size thereafter but remains larger than the original size until 3 months; after 3 months, the zone continues to decrease in size and remains smaller than the original size.
Figures 14a
Figures 14a
Recurrence after RFA in a 72-year-old woman. (a) Composite series of CT images show the enhancement pattern (left row) and the change in size (right row) with time (numbers = months after RFA). (b) Graph shows the relationship of lesion size and enhancement during the 12-month post-RFA period. The numbers along the red line represent the maximum enhancement before and after contrast material administration, and the numbers along the blue line represent the size of the tumor (before RFA) or the ablation zone. The contrast enhancement (red line) decreases immediately after ablation and remains low until 3 months, with enhancement not exceeding 15 HU. At 5 months, enhancement is increased beyond baseline and is more than 15 HU, a trend that continues at 7 months. Similarly, the lesion size (blue line) continues to increase after the initial reduction at 3 months, a finding suggestive of recurrence.
Figures 14b
Figures 14b
Recurrence after RFA in a 72-year-old woman. (a) Composite series of CT images show the enhancement pattern (left row) and the change in size (right row) with time (numbers = months after RFA). (b) Graph shows the relationship of lesion size and enhancement during the 12-month post-RFA period. The numbers along the red line represent the maximum enhancement before and after contrast material administration, and the numbers along the blue line represent the size of the tumor (before RFA) or the ablation zone. The contrast enhancement (red line) decreases immediately after ablation and remains low until 3 months, with enhancement not exceeding 15 HU. At 5 months, enhancement is increased beyond baseline and is more than 15 HU, a trend that continues at 7 months. Similarly, the lesion size (blue line) continues to increase after the initial reduction at 3 months, a finding suggestive of recurrence.
Figure 15a
Figure 15a
Metastatic renal cell carcinoma in a 68-year-old woman. (a) CT image shows that the medial nodular edge of the metastasis (arrow) is too close to the bronchus and is subject to the heat sink effect. (b) PET/CT image obtained at 3-month surveillance shows a focal area of recurrence (arrowhead).
Figure 15b
Figure 15b
Metastatic renal cell carcinoma in a 68-year-old woman. (a) CT image shows that the medial nodular edge of the metastasis (arrow) is too close to the bronchus and is subject to the heat sink effect. (b) PET/CT image obtained at 3-month surveillance shows a focal area of recurrence (arrowhead).
Figure 16a
Figure 16a
Non–small cell lung carcinoma in the left upper lobe in a 73-year-old woman. (a, b) CT images at the level of the ablated mass (a) and at the level of the left lobar lymph nodes (b) obtained at 1 month after RFA show no evidence of local adenopathy. (c, d) CT (c) and PET (d) images obtained at 6-month follow-up show a left lobar well-defined local-regional lymph node (arrow), as well as right paratracheal lymph nodes (arrowheads in d) with hypermetabolic activity, findings that are consistent with metastasis.
Figure 16b
Figure 16b
Non–small cell lung carcinoma in the left upper lobe in a 73-year-old woman. (a, b) CT images at the level of the ablated mass (a) and at the level of the left lobar lymph nodes (b) obtained at 1 month after RFA show no evidence of local adenopathy. (c, d) CT (c) and PET (d) images obtained at 6-month follow-up show a left lobar well-defined local-regional lymph node (arrow), as well as right paratracheal lymph nodes (arrowheads in d) with hypermetabolic activity, findings that are consistent with metastasis.
Figure 16c
Figure 16c
Non–small cell lung carcinoma in the left upper lobe in a 73-year-old woman. (a, b) CT images at the level of the ablated mass (a) and at the level of the left lobar lymph nodes (b) obtained at 1 month after RFA show no evidence of local adenopathy. (c, d) CT (c) and PET (d) images obtained at 6-month follow-up show a left lobar well-defined local-regional lymph node (arrow), as well as right paratracheal lymph nodes (arrowheads in d) with hypermetabolic activity, findings that are consistent with metastasis.
Figure 16d
Figure 16d
Non–small cell lung carcinoma in the left upper lobe in a 73-year-old woman. (a, b) CT images at the level of the ablated mass (a) and at the level of the left lobar lymph nodes (b) obtained at 1 month after RFA show no evidence of local adenopathy. (c, d) CT (c) and PET (d) images obtained at 6-month follow-up show a left lobar well-defined local-regional lymph node (arrow), as well as right paratracheal lymph nodes (arrowheads in d) with hypermetabolic activity, findings that are consistent with metastasis.
Figure 17a
Figure 17a
Squamous cell carcinoma in the right lower lobe in a 72-year-old man treated with RFA, who had postablation fluctuation in a local-regional lymph node. (a) CT image obtained before ablation shows a subcentimeter right tracheobronchial lymph node (arrow). (b, c) CT (b) and PET/CT (c) images obtained 2 weeks after ablation show the postablation cavity (arrowheads) and the enlarged right tracheobronchial lymph node (arrows), both of which demonstrated increased metabolic activity. (d) CT image obtained at 3 months after RFA shows a decrease in the size of the ablation zone (arrowheads) and a decrease in the size of the tracheobronchial lymph node (arrow) compared with the preablation size, findings that helped exclude metastasis.
Figure 17b
Figure 17b
Squamous cell carcinoma in the right lower lobe in a 72-year-old man treated with RFA, who had postablation fluctuation in a local-regional lymph node. (a) CT image obtained before ablation shows a subcentimeter right tracheobronchial lymph node (arrow). (b, c) CT (b) and PET/CT (c) images obtained 2 weeks after ablation show the postablation cavity (arrowheads) and the enlarged right tracheobronchial lymph node (arrows), both of which demonstrated increased metabolic activity. (d) CT image obtained at 3 months after RFA shows a decrease in the size of the ablation zone (arrowheads) and a decrease in the size of the tracheobronchial lymph node (arrow) compared with the preablation size, findings that helped exclude metastasis.
Figure 17c
Figure 17c
Squamous cell carcinoma in the right lower lobe in a 72-year-old man treated with RFA, who had postablation fluctuation in a local-regional lymph node. (a) CT image obtained before ablation shows a subcentimeter right tracheobronchial lymph node (arrow). (b, c) CT (b) and PET/CT (c) images obtained 2 weeks after ablation show the postablation cavity (arrowheads) and the enlarged right tracheobronchial lymph node (arrows), both of which demonstrated increased metabolic activity. (d) CT image obtained at 3 months after RFA shows a decrease in the size of the ablation zone (arrowheads) and a decrease in the size of the tracheobronchial lymph node (arrow) compared with the preablation size, findings that helped exclude metastasis.
Figure 17d
Figure 17d
Squamous cell carcinoma in the right lower lobe in a 72-year-old man treated with RFA, who had postablation fluctuation in a local-regional lymph node. (a) CT image obtained before ablation shows a subcentimeter right tracheobronchial lymph node (arrow). (b, c) CT (b) and PET/CT (c) images obtained 2 weeks after ablation show the postablation cavity (arrowheads) and the enlarged right tracheobronchial lymph node (arrows), both of which demonstrated increased metabolic activity. (d) CT image obtained at 3 months after RFA shows a decrease in the size of the ablation zone (arrowheads) and a decrease in the size of the tracheobronchial lymph node (arrow) compared with the preablation size, findings that helped exclude metastasis.
Figure 18a
Figure 18a
Primary non–small cell lung carcinoma in a 66-year-old man. (a) CT image obtained after RFA shows a linear postablation scar (arrows) in the right lower lobe. (b) PET image shows that the scar is without metabolic activity. (c, d) CT (c) and PET (d) images obtained at the 24-month follow-up depict a new mass (arrow) in the left lobe of the liver, which shows hypermetabolic activity. (e) Photomicrograph (original magnification, ×200; H-E stain) of a histologic section of the specimen from biopsy of the liver lesion shows neoplastic cells (top half) surrounded by chronic inflammatory cells and collagen (bottom half). Inset: Photomicrograph (original magnification, ×400; immunohistochemical stain for TTF-1) of a histologic section of the specimen from biopsy shows that the neoplastic cells (arrowhead) are positive for TTF-1 (brown nuclear staining), a finding that helped confirm their pulmonary origin.
Figure 18b
Figure 18b
Primary non–small cell lung carcinoma in a 66-year-old man. (a) CT image obtained after RFA shows a linear postablation scar (arrows) in the right lower lobe. (b) PET image shows that the scar is without metabolic activity. (c, d) CT (c) and PET (d) images obtained at the 24-month follow-up depict a new mass (arrow) in the left lobe of the liver, which shows hypermetabolic activity. (e) Photomicrograph (original magnification, ×200; H-E stain) of a histologic section of the specimen from biopsy of the liver lesion shows neoplastic cells (top half) surrounded by chronic inflammatory cells and collagen (bottom half). Inset: Photomicrograph (original magnification, ×400; immunohistochemical stain for TTF-1) of a histologic section of the specimen from biopsy shows that the neoplastic cells (arrowhead) are positive for TTF-1 (brown nuclear staining), a finding that helped confirm their pulmonary origin.
Figure 18c
Figure 18c
Primary non–small cell lung carcinoma in a 66-year-old man. (a) CT image obtained after RFA shows a linear postablation scar (arrows) in the right lower lobe. (b) PET image shows that the scar is without metabolic activity. (c, d) CT (c) and PET (d) images obtained at the 24-month follow-up depict a new mass (arrow) in the left lobe of the liver, which shows hypermetabolic activity. (e) Photomicrograph (original magnification, ×200; H-E stain) of a histologic section of the specimen from biopsy of the liver lesion shows neoplastic cells (top half) surrounded by chronic inflammatory cells and collagen (bottom half). Inset: Photomicrograph (original magnification, ×400; immunohistochemical stain for TTF-1) of a histologic section of the specimen from biopsy shows that the neoplastic cells (arrowhead) are positive for TTF-1 (brown nuclear staining), a finding that helped confirm their pulmonary origin.
Figure 18d
Figure 18d
Primary non–small cell lung carcinoma in a 66-year-old man. (a) CT image obtained after RFA shows a linear postablation scar (arrows) in the right lower lobe. (b) PET image shows that the scar is without metabolic activity. (c, d) CT (c) and PET (d) images obtained at the 24-month follow-up depict a new mass (arrow) in the left lobe of the liver, which shows hypermetabolic activity. (e) Photomicrograph (original magnification, ×200; H-E stain) of a histologic section of the specimen from biopsy of the liver lesion shows neoplastic cells (top half) surrounded by chronic inflammatory cells and collagen (bottom half). Inset: Photomicrograph (original magnification, ×400; immunohistochemical stain for TTF-1) of a histologic section of the specimen from biopsy shows that the neoplastic cells (arrowhead) are positive for TTF-1 (brown nuclear staining), a finding that helped confirm their pulmonary origin.
Figure 18e
Figure 18e
Primary non–small cell lung carcinoma in a 66-year-old man. (a) CT image obtained after RFA shows a linear postablation scar (arrows) in the right lower lobe. (b) PET image shows that the scar is without metabolic activity. (c, d) CT (c) and PET (d) images obtained at the 24-month follow-up depict a new mass (arrow) in the left lobe of the liver, which shows hypermetabolic activity. (e) Photomicrograph (original magnification, ×200; H-E stain) of a histologic section of the specimen from biopsy of the liver lesion shows neoplastic cells (top half) surrounded by chronic inflammatory cells and collagen (bottom half). Inset: Photomicrograph (original magnification, ×400; immunohistochemical stain for TTF-1) of a histologic section of the specimen from biopsy shows that the neoplastic cells (arrowhead) are positive for TTF-1 (brown nuclear staining), a finding that helped confirm their pulmonary origin.

Similar articles

Cited by

References

    1. American Cancer Society Cancer facts and figures 2011. American Cancer Society Web site. http://www.cancer.org/Research/CancerFactsFigures/Cancer FactsFigures/cancer-facts-figures-2011. Published 2011. Accessed October 18, 2011
    1. Davidson RS, Nwogu CE, Brentjens MJ, Anderson TM. The surgical management of pulmonary metastasis: current concepts. Surg Oncol 2001;10(1-2):35–42 - PubMed
    1. Mery CM, Pappas AN, Burt BM, et al. Diameter of non-small cell lung cancer correlates with long-term survival: implications for T stage. Chest 2005;128(5):3255–3260 - PubMed
    1. McGarry RC, Song G, des Rosiers P, Timmerman R. Observation-only management of early stage, medically inoperable lung cancer: poor outcome. Chest 2002;121(4):1155–1158 - PubMed
    1. Kyasa MJ, Jazieh AR. Characteristics and outcomes of patients with unresected early-stage non-small cell lung cancer. South Med J 2002;95(10):1149–1152 - PubMed