. 2012 Jul 11;32(28):9511-6.
doi: 10.1523/JNEUROSCI.1212-12.2012.

Long-term potentiation in the neonatal rat barrel cortex in vivo

Affiliations

Long-term potentiation in the neonatal rat barrel cortex in vivo

Shuming An et al. J Neurosci. .

Abstract

Long-term potentiation (LTP) is important for the activity-dependent formation of early cortical circuits. In the neonatal rodent barrel cortex, LTP has been studied only in vitro. We combined voltage-sensitive dye imaging with extracellular multielectrode recordings to study whisker stimulation-induced LTP in the whisker-to-barrel cortex pathway of the neonatal rat barrel cortex in vivo. Single whisker stimulation at 2 Hz for 10 min induced an age-dependent expression of LTP in postnatal day (P) 0 to P14 rats, with the strongest expression of LTP at P3-P5. The magnitude of LTP was largest in the activated barrel-related column, smaller in the surrounding septal region, and no LTP could be observed in the neighboring barrel. Current source density analyses revealed an LTP-associated increase of synaptic current sinks in layer IV/lower layer II/III at P3-P5 and in the cortical plate/upper layer V at P0-P1. Our study demonstrates for the first time an age-dependent and spatially confined LTP in the barrel cortex of the newborn rat in vivo.


Conflict of interest statement

The authors have declared that no conflict of interest exists.

Figures
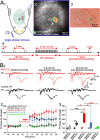
Figure 1.
Figure 1.
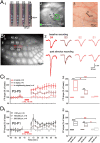
Mechanical deflection of a single whisker for 10 min at 2 Hz elicits LTP in barrel cortex of newborn rats in vivo. A, Schematic diagram of the experimental setup illustrating selective mechanical stimulation of the C2 whisker (A1) and simultaneous VSDI in the barrel cortex (A2). The exposed barrel cortex was stained with the voltage-sensitive dye RH1691. A single-whisker deflection of the C2 whisker elicits a local VSDI response in a P3 rat. The green dot indicates the center of the C2 barrel-related cortical column. The black dot is the electrode insertion position. Orange represents the region of the C2 whisker stimulation-evoked VSDI response. A3 shows the same area after termination of the electrophysiological recording and retraction of the recording electrode. The red dot and arrowhead show the electrode insertion point. A4, Stimulation protocol for induction of LTP. During baseline recording, the whisker was deflected twice per 5 min at 1 min intervals for 30 min. For LTP induction, the whisker was deflected at a frequency of 2 Hz for 10 min. Afterward, the same two stimuli per 5 min were used again for 60 min during the poststimulation recording period. B, Time course of FP responses before and after induction of LTP. B1, Representative FP recording during baseline and the 5–30 and 35–60 min phases after 2 Hz stimulation (red) or without 2 Hz stimulation (black) in a P4 rat. B2, Relative FP slopes recorded in different age groups and in P3–P5 control group. Data are expressed as mean ± SEM. B3, Box plots of FP slopes in P3–P5 control and LTP groups of different ages with baseline and 35–60 min poststimulation.
Figure 2.
Figure 2.
Spatial properties of LTP induced by repetitive single-whisker stimulation. A, Photograph of the 4 × 4-channel Michigan electrode array (A1). A local VSDI response was elicited by C2 single-whisker deflection in a P4 rat (A2). The green dot indicates the center of the C2 barrel-related cortical column. The black dots are the electrode insertion positions. The green circle represents the region of the C2 whisker stimulation-evoked VSDI response. A3 shows the same area as in A2 after termination of the electrophysiological recordings and retraction of the recording electrode. The red dots and arrowheads show the electrode insertion points. B1, Photomicrograph of tangential section through layer IV of the barrel field of a P5 rat after processing the tissue for 5-HTT staining. Colored arrowheads indicate different locations of the four shanks of the 4 × 4-channel Michigan electrode. B2, FP responses recorded in the activated barrel-related column, in the neighboring septum, and in an adjacent barrel during baseline and post-LTP induction periods from the same P5 rat as shown in B1. C1, Mean ± SEM of relative FP responses recorded in the stimulated barrel (square), in the surrounding septal region (circle), and in the neighboring barrel (diamond) of P3–P5 rats. C2, Box plots of FP slopes recorded in barrel, septa, and neighboring barrel of P3–P5 rats averaged for baseline and 35–60 min post-LTP induction. D1, Mean ± SEM of relative FP slopes recorded in various distances from the center of the activated barrel in P0–P1 rats. D2, Box plots of FP slopes in various distances from the center of the stimulated barrel in P0–P1 rats averaged for baseline and 35–60 min post-LTP induction.
Figure 3.
Figure 3.
Representative FP response depth profiles and corresponding CSD analyses before and after induction of LTP in a P4 (B) and P0 (C) rat. A, photograph of the 1 × 16-channel Michigan electrode array (left). Digital photomontage reconstructing the location of the DiI-covered electrode in coronal Nissl-stained section (right). B, C, Depth profiles of FP responses to single-whisker stimulation and corresponding CSD analyses in a P4 and P0 rat. The interelectrode distance was 100 μm in the P4 rat and 50 μm in the P0 rat. B1, C1, Control data obtained during baseline recording. B2, C2, Data after LTP induction. In CSD analyses, current sinks (blue) are downward-going and current sources (red) are upward-going. D, Relative FP slopes recorded in layer II/III and IV at P3–P5. E, Relative FP slopes recorded in the cortical plate and deep layer at P0–P1. Data are expressed as mean ± SEM. Box plots represent FP slopes during baseline and 35–60 min post-LTP induction (right). MZ, marginal zone; WM, white matter; SP, subplate; CP, cortical plate.

References

    1. Barth AL, Malenka RC. NMDAR EPSC kinetics do not regulate the critical period for LTP at thalamocortical synapses. Nat Neurosci. 2001;4:235–236. - PubMed
    1. Berger T, Borgdorff A, Crochet S, Neubauer FB, Lefort S, Fauvet B, Ferezou I, Carleton A, Lüscher HR, Petersen CC. Combined voltage and calcium epifluorescence imaging in vitro and in vivo reveals subthreshold and suprathreshold dynamics of mouse barrel cortex. J Neurophysiol. 2007;97:3751–3762. - PubMed
    1. Carvell GE, Simons DJ. Biometric analyses of vibrissal tactile discrimination in the rat. J Neurosci. 1990;10:2638–2648. - PMC - PubMed
    1. Crair MC, Malenka RC. A critical period for long-term potentiation at thalamocortical synapses. Nature. 1995;375:325–328. - PubMed
    1. Daw MI, Scott HL, Isaac JT. Developmental synaptic plasticity at the thalamocortical input to barrel cortex: mechanisms and roles. Mol Cell Neurosci. 2007;34:493–502. - PMC - PubMed

Publication types

Substances