. 2012 Aug 24;287(35):29921-30.
doi: 10.1074/jbc.M112.363911. Epub 2012 Jul 11.

SLC33A1/AT-1 protein regulates the induction of autophagy downstream of IRE1/XBP1 pathway

Affiliations

SLC33A1/AT-1 protein regulates the induction of autophagy downstream of IRE1/XBP1 pathway

Mariana Pehar et al. J Biol Chem. .

Abstract

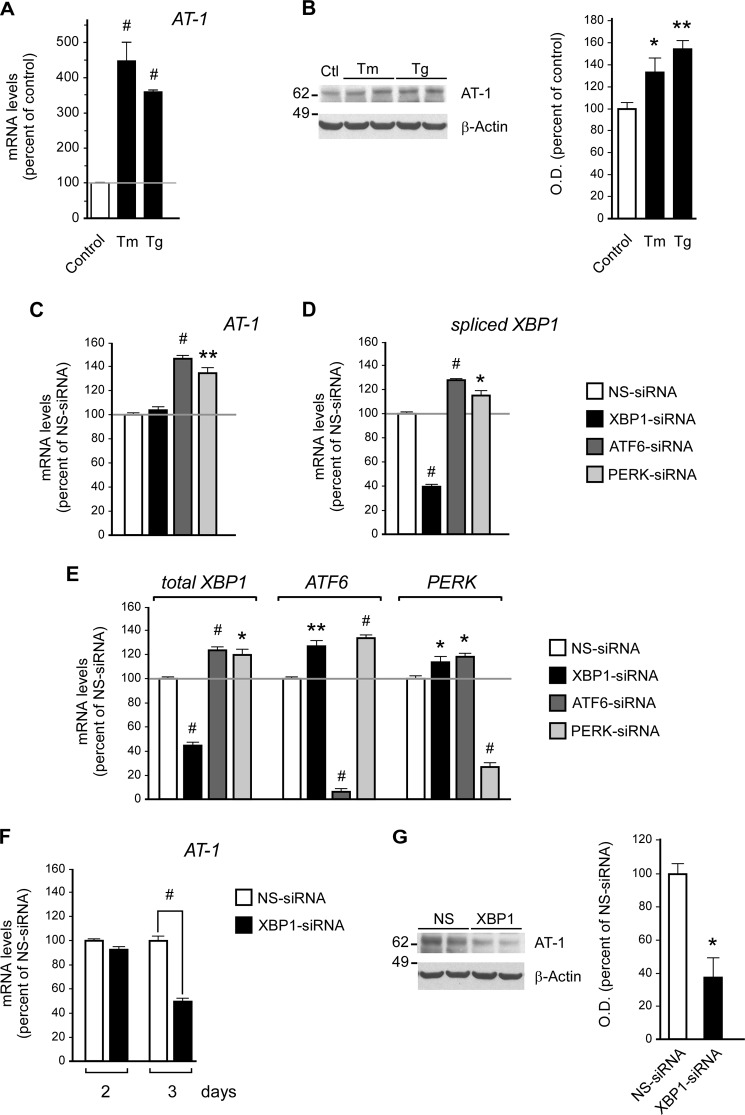
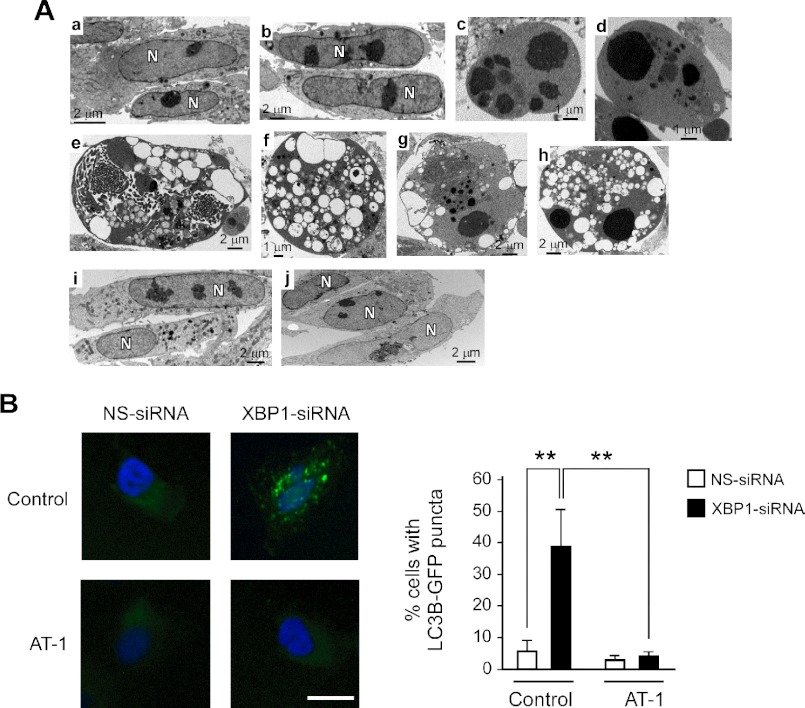
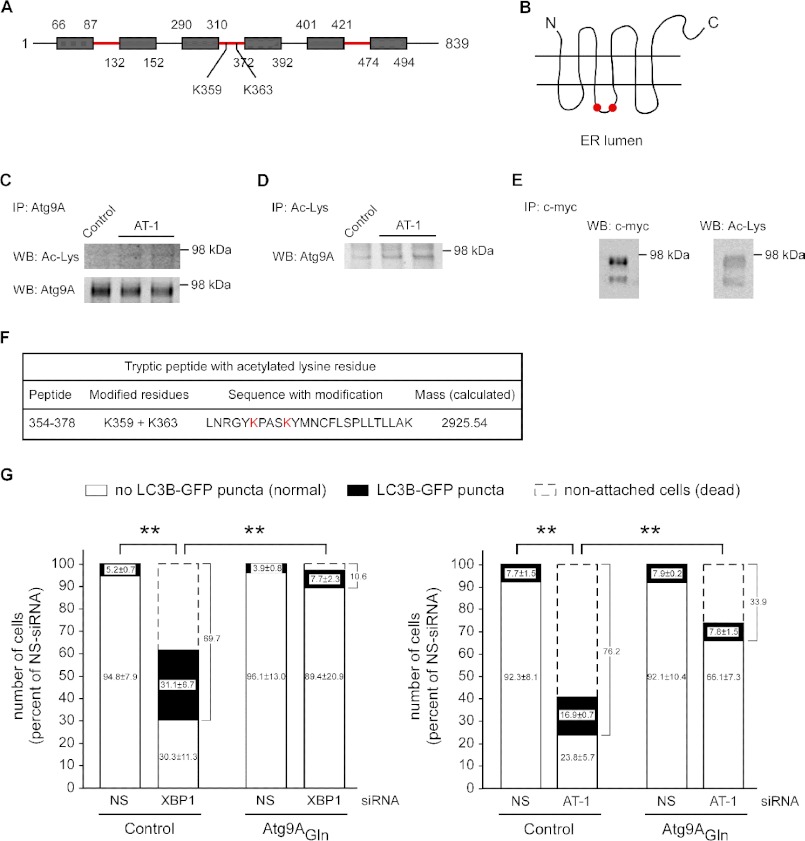
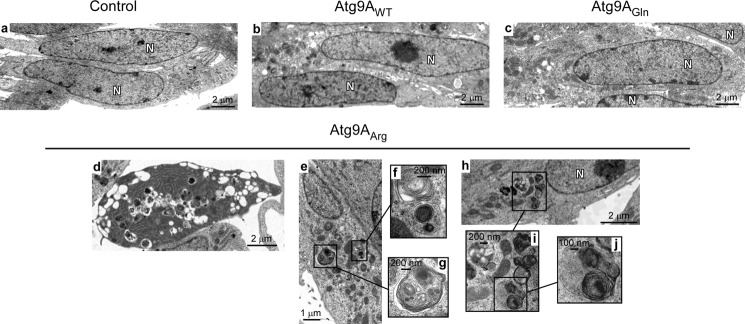
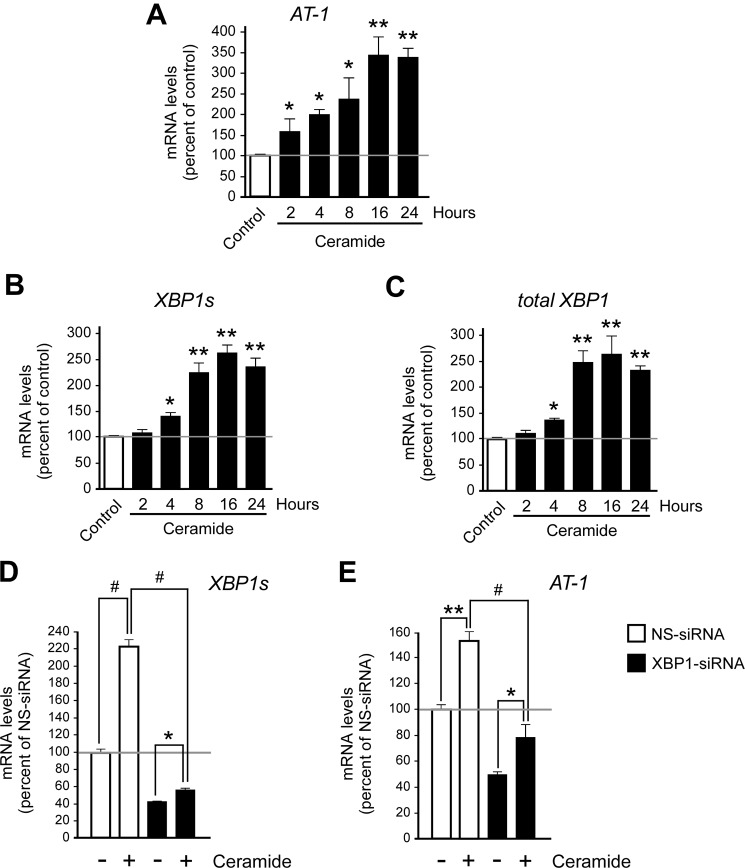
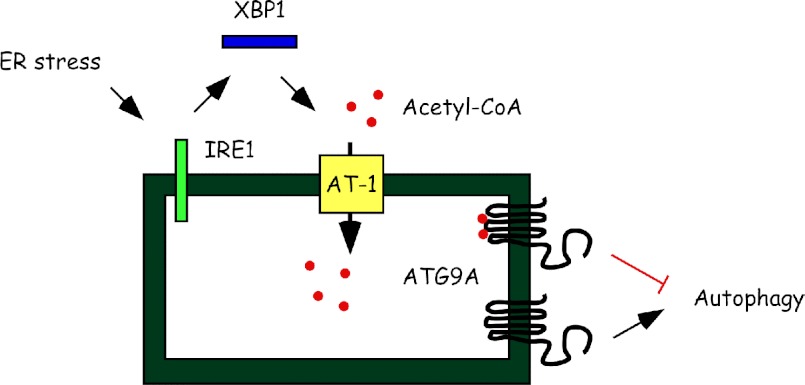
One of the main functions of the unfolded protein response is to ensure disposal of large protein aggregates that accumulate in the lumen of the endoplasmic reticulum (ER) whereas avoiding, at least under nonlethal levels of ER stress, cell death. When tightly controlled, autophagy-dependent ER-associated degradation (ERAD(II)) allows the cell to recover from the transient accumulation of protein aggregates; however, when unchecked, it can be detrimental and cause autophagic cell death/type 2 cell death. Here we show that IRE1/XBP1 controls the induction of autophagy/ERAD(II) during the unfolded protein response by activating the ER membrane transporter SLC33A1/AT-1, which ensures continuous supply of acetyl-CoA into the lumen of the ER. Failure to induce AT-1 leads to widespread autophagic cell death. Mechanistically, the regulation of the autophagic process involves N(ε)-lysine acetylation of Atg9A.


Figures

FIGURE 1.
FIGURE 1.
AT-1 acts downstream of XBP1. A and B, H4 cells were treated with either tunicamycin (Tm; 2 μg/ml) or thapsigargin (Tg; 200 nm) prior to quantitative real-time PCR analysis of AT-1 mRNA levels (A, treatment was for 6 h) and Western blot assessment of AT-1 protein levels (B, treatment was for 10 h). Results are expressed as the percentage of control and are the average (n ≥ 3) + S.E. *, p < 0.05; **, p < 0.005; #, p < 0.0005. O. D., optical density. C–E, H4 cells were treated with siRNA for 2 days prior to quantitative real-time PCR. The mRNA levels of AT-1 (C), XBP1s (D), and the other UPR branches (E) are shown. The results in E suggest compensatory cross-talk between the three UPR signaling branches. F, at least 3 days of XBP1 siRNA treatment were necessary to observe significant down-regulation of AT-1 mRNA levels. G, Western blot assessment of AT-1 protein levels following 3 days of XBP1 siRNA treatment. Results in C–G are expressed as the percentage of nonsilencing siRNA (NS-siRNA) and are the average (n = 3) + S.E. *, p < 0.05; **, p < 0.005; #, p < 0.0005.
FIGURE 2.
FIGURE 2.
AT-1 acts downstream of XBP1 to prevent autophagic cell death. A, H4 cells were treated with XBP1 siRNAs for 4 days prior to transmission EM. Panel a, control (untreated) cells; panel b, NS siRNA-treated cells; panel c, ATF6 siRNA-treated cells; panel d, PERK siRNA-treated cells; panels e–h, XBP1 siRNA-treated cells; panels i–j, XBP1 siRNA treatment of AT-1-overexpressing cells. Panels c and d show chromatin condensation and cytoplasmic changes that are typical of apoptosis. Panels e–h show cells with features that are typical of autophagic cell death. They include cellular blebbing, the presence of several large vacuoles, and no visible organelles. Some of the vacuoles contain dense lysosomal material. Panels i and j show normal features and no evidence of autophagic cell death. B, H4 cells were treated with nonsilencing (NS-siRNA) or XBP1-specific (XBP1-siRNA) siRNAs for 3 days and then transduced with GFP-LC3B BacMam. The induction of autophagy, as assessed by the redistribution of LC3B, was evaluated 24 h later. Total treatment with siRNA was 4 days. The same experiment was performed with both control (empty plasmid) and AT-1-overexpressing H4 cells. Representative images are shown in the left panel, whereas the quantitative data are shown in the right panel. Nuclei were counterstained with DAPI (blue). Bar: 10 μm. Results are the average (n ≥ 6) + S.E. **, p < 0.005. Successful down-regulation of XBP1 in CMV-AT-1-overexpressing cells is shown in supplemental Fig. S4.
FIGURE 3.
FIGURE 3.
Atg9A is acetylated in the lumen of the ER and acts downstream of AT-1 to prevent the induction of autophagy in XBP1 siRNA-treated cells. A, topology of Atg9A. Transmembrane domains are indicated as gray boxes, whereas regions that face the ER lumen are in red. The location of modified lysines Lys-359 and Lys-363 is also indicated. B, schematic view of Atg9A arrangement across the ER membrane. Modified lysines Lys-359 and Lys-363 are indicated by two red dots. C, endogenous Atg9A was immunoprecipitated (IP) from a crude preparation of intracellular membranes and then analyzed with both anti-acetylated lysine (upper panel) and anti-Atg9A (lower panel) antibodies. WB, Western blot. D, the same membrane preparation was also immunoprecipitated with an antibody against acetylated lysine residues and then analyzed with an anti-Atg9A antibody. E, a Myc-tagged version of Atg9A was immunoprecipitated from stable transfected cells and analyzed with the indicated antibodies. F, tryptic peptide with the acetylated lysine residues identified by mass spectrometry. For LC-MS/MS, Atg9A was purified from cells that did not overexpress AT-1. G, control (empty plasmid) and Atg9AGln-overexpressing H4 cells were treated with nonsilencing (NS-siRNA), XBP1-specific (XBP1-siRNA), or AT-1-specific (AT-1-siRNA) siRNAs for 3 days and then transduced with GFP-LC3B BacMam. The induction of autophagy, as assessed by the redistribution of LC3B, was evaluated 24 h later. Total treatment with siRNA was 4 days. The number of dead cells was also calculated. Results are the average (n ≥ 6) + S.E. **, p < 0.005.
FIGURE 4.
FIGURE 4.
The loss-of-acetylation mutant form of Atg9A induces cell death as well as features of autophagy. Panels a–j, H4 cells overexpressing WT (Atg9AWT), K359Q/K363Q (Atg9AGln; gain-of-acetylation) or K359R/K363R (Atg9AArg; loss-of-acetylation) versions of Atg9A were analyzed with transmission electron microscopy in the absence of any treatment. Different cellular features that are typical of the early stages of autophagy were observed in cells overexpressing Atg9AArg (panels d–j). Nuclei are labeled with N. Mitochondria appear normal. Control indicates cells transfected with an empty plasmid.
FIGURE 5.
FIGURE 5.
The induction of AT-1 as a result of ceramide treatment is concomitant with the activation of IRE1/XBP1 signaling. A–C, human neuroglioma (H4) cells were treated with 10 μm ceramide for the indicated periods of time prior to the analysis of the kinetics of activation of AT-1 and XBP1. A, quantitative real-time PCR of AT-1 mRNA levels. B and C, quantitative real-time PCR of XBP1s (B) and total XBP1 (C) mRNA levels. Results are expressed as the percentage of control and are the average (n ≥ 3) + S.E. *, p < 0.05; **, p < 0.005. D and E, H4 cells were treated with nonsilencing (NS-siRNA) or XBP1-specific (XBP1-siRNA) siRNA in the presence or absence of ceramide. Total treatment with siRNA was 3 days, whereas ceramide exposure was limited to the last 8 h. Changes in XBP1s (D) and AT-1 (E) mRNA levels are shown. Results are expressed as the percentage of nonsilencing siRNA and are the average (n ≥ 5) + S.E. *, p < 0.05; **, p < 0.005; #, p < 0.0005.
FIGURE 6.
FIGURE 6.
Schematic summary and proposed model. ER stress activates IRE1/XBP1 signaling to regulate the influx of acetyl-CoA into the ER lumen through the membrane transporter AT-1. Acetyl-CoA levels in the lumen of the ER determine the acetylation status of Atg9A, which acts as the last output for the induction of autophagy/ERAD(II) during the UPR. Acetylated (with red dots) Atg9A prevents autophagy, whereas nonacetylated (without red dots) Atg9A activates autophagy.

Similar articles

Cited by

References

    1. Trombetta E. S., Parodi A. J. (2003) Quality control and protein folding in the secretory pathway. Annu. Rev. Cell Dev. Biol. 19, 649–676 - PubMed
    1. Kleizen B., Braakman I. (2004) Protein folding and quality control in the endoplasmic reticulum. Curr. Opin. Cell Biol. 16, 343–349 - PubMed
    1. Buchberger A., Bukau B., Sommer T. (2010) Protein quality control in the cytosol and the endoplasmic reticulum: brothers in arms. Mol. Cell 40, 238–252 - PubMed
    1. Klionsky D. J. (2006) Neurodegeneration: good riddance to bad rubbish. Nature 441, 819–820 - PubMed
    1. Bergmann A. (2007) Autophagy and cell death: no longer at odds. Cell 131, 1032–1034 - PMC - PubMed

Publication types

MeSH terms