. 2012 Aug 31;287(36):30117-27.
doi: 10.1074/jbc.M112.367326. Epub 2012 Jul 11.

p53, a target of estrogen receptor (ER) α, modulates DNA damage-induced growth suppression in ER-positive breast cancer cells

Affiliations

p53, a target of estrogen receptor (ER) α, modulates DNA damage-induced growth suppression in ER-positive breast cancer cells

Crystal E Berger et al. J Biol Chem. .

Abstract

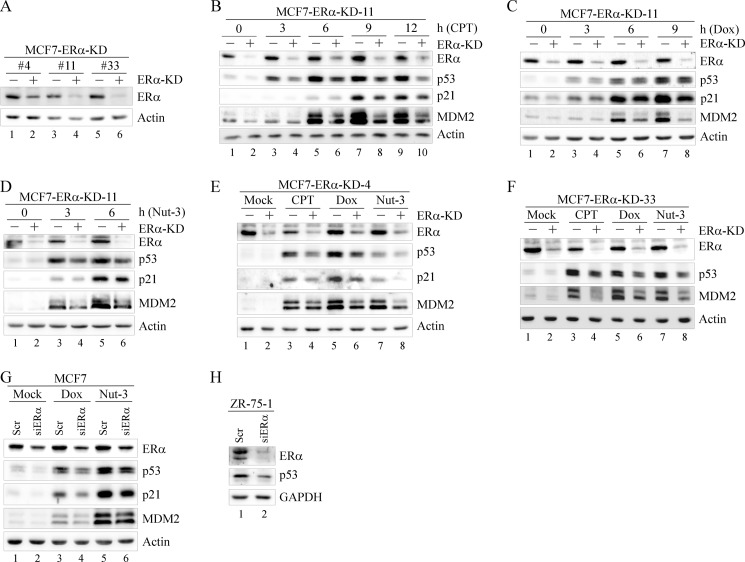
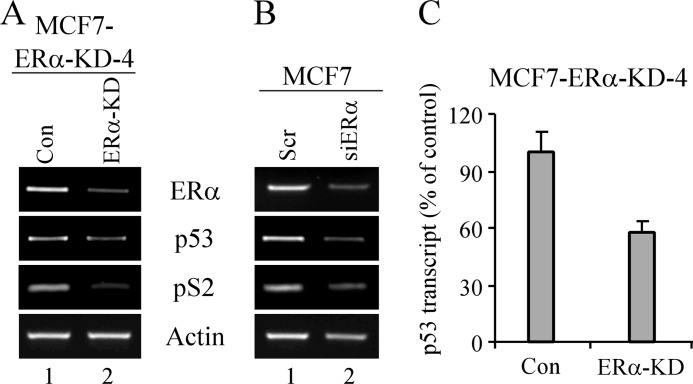
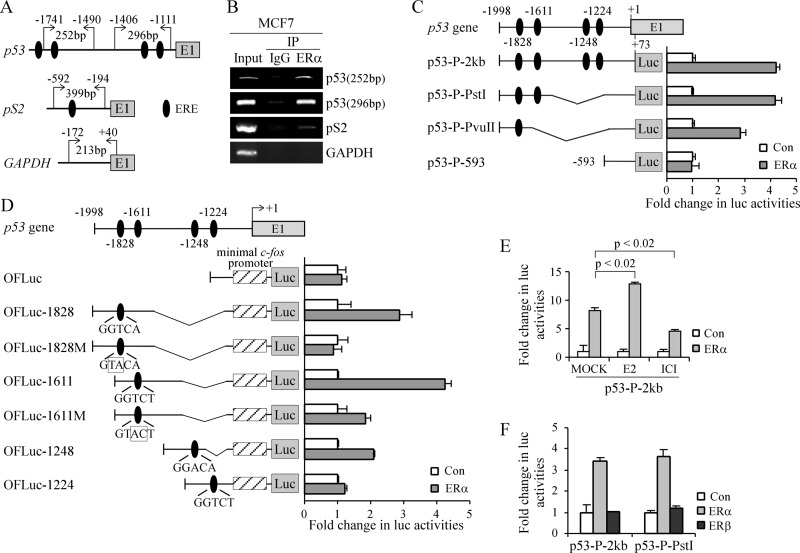
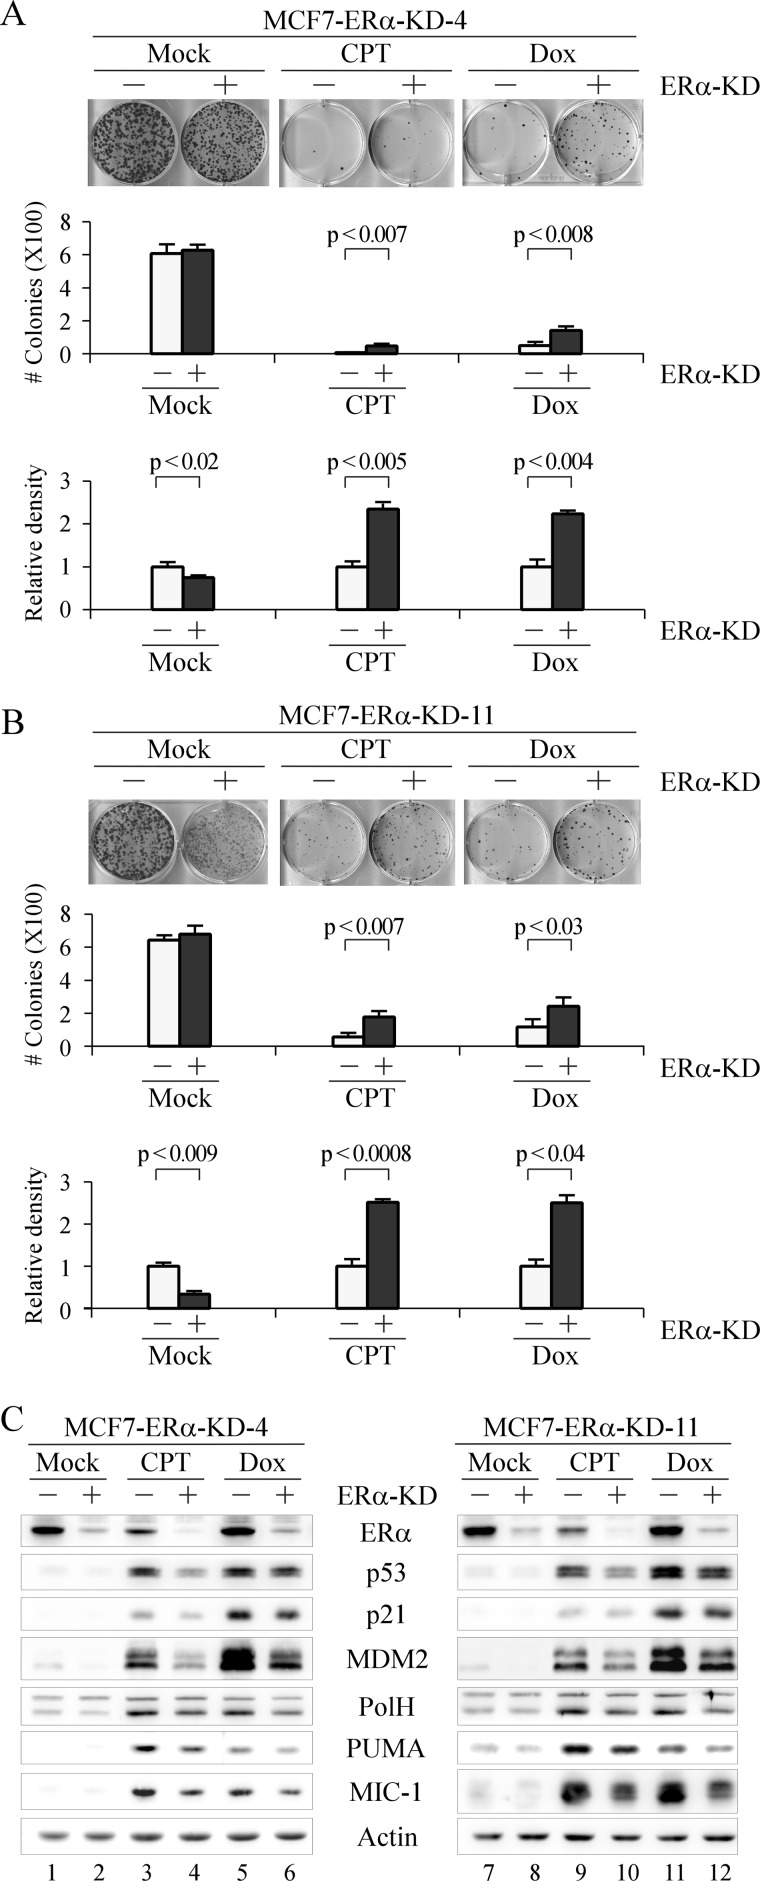
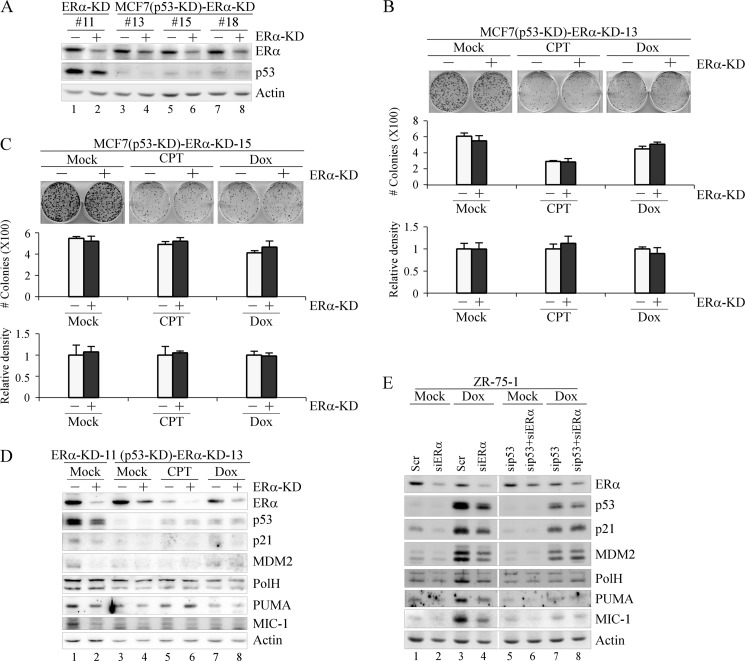
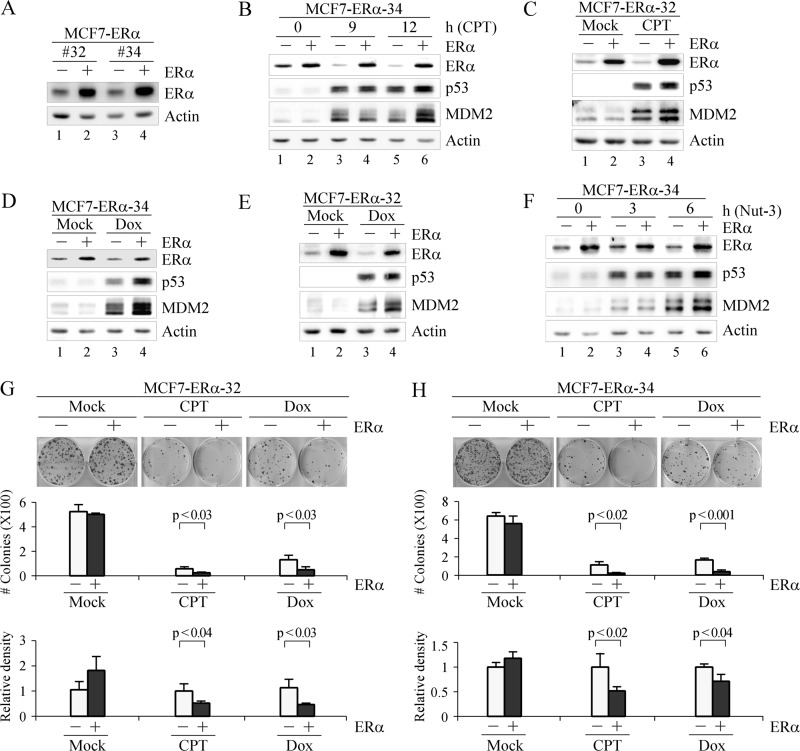
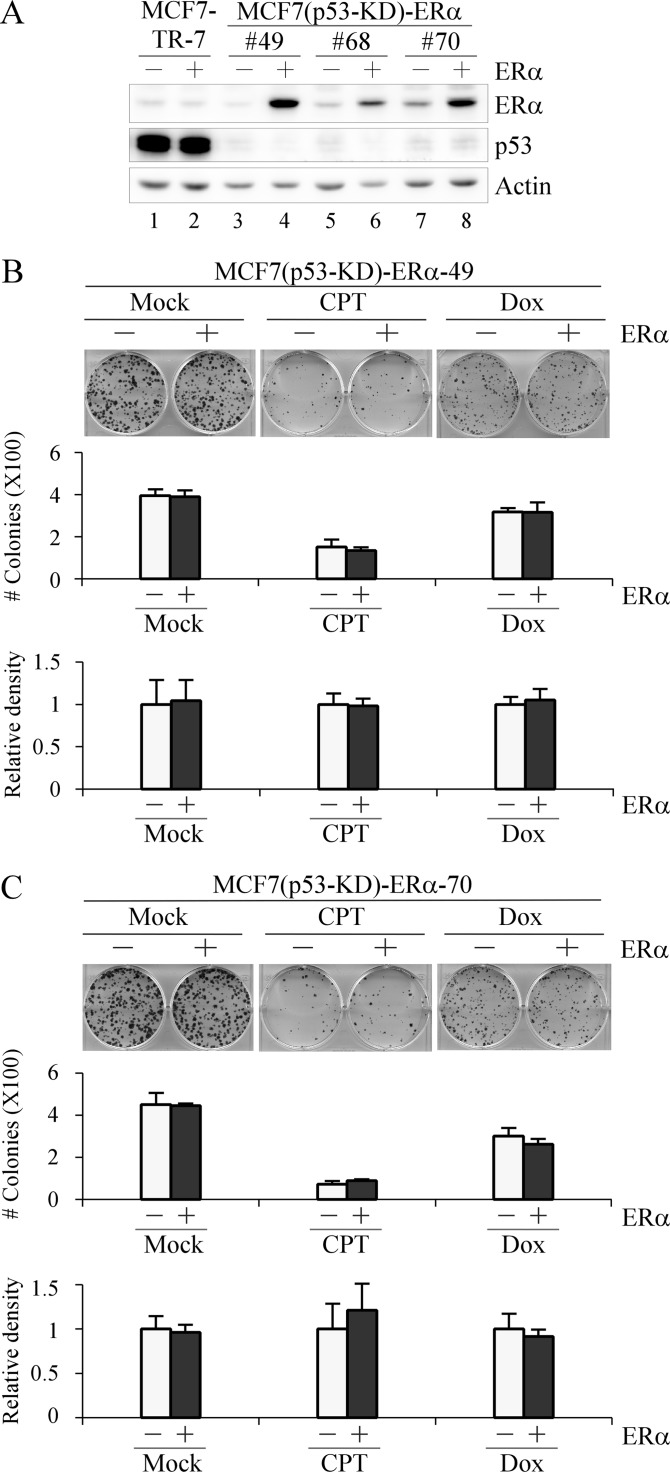
In response to genotoxic stress, the p53 tumor suppressor induces target genes for cell cycle arrest, apoptosis, and DNA repair. Although p53 is the most commonly mutated gene in all human cancers, it is only mutated in about 20% of breast cancers. 70% of all breast cancer cases are estrogen receptor (ER)-positive and express ERα. ER-positive breast cancer generally indicates good patient prognosis and treatment responsiveness with antiestrogens, such as tamoxifen. However, ER-positive breast cancer patients can experience loss or a reduction in ERα, which is associated with aggressive tumor growth, increased invasiveness, poor prognosis, and loss of p53 function. Consistent with this, we found that p53 is a target gene of ERα. Specifically, we found that knockdown of ERα decreases expression of p53 and its downstream targets, MDM2 and p21. In addition, we found that ERα activates p53 transcription via binding to estrogen response element half-sites within the p53 promoter. Moreover, we found that loss of ERα desensitizes, whereas ectopic expression of ERα sensitizes, breast cancer cells to DNA damage-induced growth suppression in a p53-dependent manner. Altogether, this study provides an insight into a feedback loop between ERα and p53 and a biological role of p53 in the DNA damage response in ER-positive breast cancers.


Figures

FIGURE 1.
FIGURE 1.
Knockdown of ERα inhibits p53 expression. A, generation of MCF7 cell lines in which ERα is inducibly knocked down. Western blots were prepared with extracts from MCF7 cells uninduced (−) or induced (+) to express ERα shRNA for 72 h. B–D, knockdown of ERα decreased the expression of p53. Western blots were prepared with MCF7-ERα-KD-11 cells that were uninduced (−) or induced (+) to knock down ERα followed by mock treatment or treatment with CPT (250 nm) for 0, 3, 6, 9, or 12 h (B); treatment with Dox (400 nm) for 0, 3, 6, or 9 h (C); and treatment with Nut-3 (7 μm) for 0, 3, or 6 h (D). E and F, Western blots were prepared with MCF7-ERα-KD-4 (E) or MCF7-ERα-KD-33 (F) cells that were uninduced (−) or induced (+) to knock down ERα followed by mock treatment or treatment with CPT (250 nm), Dox (400 nm) for 9 h, and Nut-3 (7 μm) for 6 h. G, Western blots were prepared with MCF7 cells that were transiently transfected with scrambled (Scr) or ERα siRNA (siERα) for 72 h and then mock-treated or treated with Dox (400 nm) or Nut-3 (7 μm) for 6 h. H, Western blots were prepared with ZR-75-1 cells that were transiently transfected with scrambled or ERα siRNA for 72 h. ERα, p53, MDM2, p21, GAPDH, and actin were detected by their respective antibodies.
FIGURE 2.
FIGURE 2.
Knockdown of ERα reduces p53 transcription. A, the levels of transcripts for ERα, p53, pS2, and actin were measured by RT-PCR with total RNA purified from MCF7 cells uninduced (−) or induced (+) to express ERα shRNA for 72 h. B, RT-PCR was performed with total RNA from MCF7 cells transiently transfected with scrambled (Scr) or ERα siRNA (siERα) for 72 h. C, the level of p53 transcripts was analyzed by quantitative real time RT-PCR with cDNAs from A. Results were normalized to GAPDH (error bars represent S.D.; n = 3). Con, control.
FIGURE 3.
FIGURE 3.
p53 is a transcriptional target of ERα. A, schematic presentation of p53, pS2, and GAPDH promoters with the location of potential EREs and primers used for ChIP assays. B, ERα binds to the p53 promoter in vivo. MCF7 chromatin was immunoprecipitated (IP) with anti-ERα or a control IgG. EREs on the p53 and pS2 promoters were amplified by PCR. C, left panel, schematic representation of luciferase reporter constructs. Right panel, luciferase (Luc) activity measured in the presence or absence of ERα. D, left panel, schematic representation of OFLuc luciferase reporter constructs. Right panel, luciferase activity measured in the presence or absence of ERα. E, luciferase activity measured in the presence or absence of ERα along with mock treatment or treatment with estrogen (E2) or ICI 182,780 (ICI). F, luciferase activity measured in the presence or absence of ERα or ERβ. Error bars represent S.D.; n = 3. Con, control.
FIGURE 4.
FIGURE 4.
Knockdown of ERα decreases cell sensitivity to DNA damage-inducing growth suppression. A and B, top panel, a colony formation assay was performed in triplicate with MCF7-ERα-KD-4 (A) or -11 (B) cells uninduced (−) or induced (+) to knock down ERα for 72 h followed by mock treatment or treatment with CPT (250 nm) for 6 h or Dox (100 nm) for 2 h and then maintained for 15 days. Middle panel, the number of colonies was counted using the UVP VisionWorksLS software (error bars represent S.D.; n = 3). Bottom panel, all stained cells in a well were scanned using the UVP VisionWorksLS software to determine total cell density. The density of MCF7 cells without ERα-KD was arbitrarily set at 1.0 regardless of mock treatment or treatment with CPT and Dox. The -fold change in cell density by ERα-KD was calculated in triplicate (error bars represent S.D.; n = 3). C, Western blots were prepared with extracts from MCF7-ERα-KD-4 (left panel) or -11 (right panel) cells were uninduced (−) or induced (+) to knock down ERα followed by mock treatment or treatment with CPT (250 nm) or Dox (400 nm) for 9 h. ERα, p53, p21, MDM2, PolH, PUMA, MIC-1, and actin were detected by their respective antibodies.
FIGURE 5.
FIGURE 5.
The effect of ERα-KD on cell proliferation is p53-dependent. A, generation of MCF7 cell lines in which p53 is stably knocked down and ERα can be inducibly knocked down. Western blots were prepared with extracts from MCF7-ERα-KD-11, MCF7(p53-KD)-ERα-KD-13, -15, and -18 cells uninduced (−) or induced (+) to knock down ERα. ERα, p53, and actin were detected by their respective antibodies. B and C, top panel, colony formation assay was performed in triplicate with MCF7(p53-KD)-ERα-KD-13 (B) or -15 (C) cells uninduced (−) or induced (+) to knock down ERα for 72 h followed by mock treatment or treatment with CPT (250 nm) for 6 h or Dox (100 nm) for 2 h and then maintained for 15 days. Middle panel, the number of colonies was counted using the UVP VisionWorksLS software (error bars represent S.D.; n = 3). Bottom panel, all stained cells in a well were scanned using the UVP VisionWorks LS software to determine total cell density. The density of MCF7 cells without ERα-KD was arbitrarily set at 1.0 regardless of mock treatment or treatment with CPT and Dox. The -fold change in cell density by ERα-KD was calculated in triplicate (error bars represent S.D.; n = 3). D, Western blots were prepared with extracts from MCF7(p53-KD)-ERα-KD-13 cells that were uninduced (−) or induced (+) to knock down ERα followed by mock treatment or treatment with CPT (250 nm) or Dox (400 nm) for 9 h. ERα, p53, p21, MDM2, PolH, PUMA, MIC-1, and actin were detected by their respective antibodies. MCF7-ERα-KD-11 cells that were uninduced (−) or induced (+) to knock down ERα were used as a control. E, Western blots were prepared with extracts from ZR-75-1 cells that were transiently transfected with scrambled (Scr) and/or ERα siRNA (siERα) (left panel) and p53 (sip53) and/or ER siRNA (right panel) for 72 h followed by mock treatment or treatment with Dox (400 nm) for 9 h. ERα, p53, p21, MDM2, PolH, PUMA, MIC-1, and actin were detected by their respective antibodies.
FIGURE 6.
FIGURE 6.
Overexpression of ERα increases p53 levels and MCF7 cell sensitivity to DNA damage-induced growth suppression. A, generation of MCF7 cell lines in which ERα can be inducibly expressed. B, Western blots were prepared with extracts from MCF7-ERα-34 cells that were uninduced (−) or induced (+) to express ERα for 24 h followed by mock treatment or treatment with CPT (250 nm) for 9 and 12 h. C, Western blots were prepared with extracts from MCF7-ERα-32 cells that were uninduced (−) or induced (+) to express ERα for 24 h followed by mock treatment or treatment with CPT (250 nm) for 9 h. D and E, extracts for Western blots were prepared as in C except that Dox (150 nm) was used to treat MCF7-ERα-34 (D) and -32 (E) cells for 9 h. F, extracts for Western blots were prepared as in B except that cells were treated with Nut-3 (7 μm) for 3 and 6 h. ERα, p53, MDM2, and actin were detected by their respective antibodies. G and H, top panel, a colony formation assay was performed in triplicate with MCF7-ERα-32 (G) or -34 (H) cells uninduced (−) or induced (+) to express ERα for 48 h followed by mock treatment or treatment with CPT (250 nm) for 6 h or Dox (100 nm) for 2 h and then maintained for 15 days. Middle panel, the number of colonies was counted using the UVP VisionWorksLS software (error bars represent S.D.; n = 3). Bottom panel, all stained cells in a well were scanned using the UVP VisionWorksLS software to determine total cell density. The density of MCF7 cells without ERα overexpression was arbitrarily set at 1.0 regardless of mock treatment or treatment with CPT and Dox. The -fold change in cell density by ERα overexpression was calculated in triplicate (error bars represent S.D.; n = 3).
FIGURE 7.
FIGURE 7.
The effect of ERα overexpression on cell sensitivity to DNA damage-induced growth suppression is p53-dependent. A, generation of MCF7 cell lines in which p53 is stably knocked down and ERα can be inducibly expressed. Western blots were prepared with extracts from MCF7(p53-KD)-ERα-49, -68, or -70 cells that were uninduced (−) or induced (+) to express ERα for 24 h. B and C, top panel, a colony formation assay was performed in triplicate with MCF7(p53-KD)-ERα-49 (B) and -70 (C) cells uninduced (−) or induced (+) to express ERα for 48 h followed by mock treatment or treatment with CPT (250 nm) for 6 h or Dox (100 nm) for 2 h and then maintained for 15 days. Middle panel, the number of colonies was counted using the UVP VisionWorksLS software (error bars represent S.D.; n = 3). Bottom panel, all stained cells in a well were scanned using the UVP VisionWorksLS software to determine total cell density. The density of MCF7 cells without ERα overexpression was arbitrarily set at 1.0 regardless of mock treatment or treatment with CPT and Dox. The -fold change in cell density by ERα overexpression was calculated in triplicate (error bars represent S.D.; n = 3).

References

    1. Mosselman S., Polman J., Dijkema R. (1996) ERβ: identification and characterization of a novel human estrogen receptor. FEBS Lett. 392, 49–53 - PubMed
    1. Kuiper G. G., Carlsson B., Grandien K., Enmark E., Häggblad J., Nilsson S., Gustafsson J. A. (1997) Comparison of the ligand binding specificity and transcript tissue distribution of estrogen receptors α and β. Endocrinology 138, 863–870 - PubMed
    1. Stanford J. L., Szklo M., Brinton L. A. (1986) Estrogen receptors and breast cancer. Epidemiol. Rev. 8, 42–59 - PubMed
    1. Leygue E., Dotzlaw H., Watson P. H., Murphy L. C. (1998) Altered estrogen receptor α and β messenger RNA expression during human breast tumorigenesis. Cancer Res. 58, 3197–3201 - PubMed
    1. Lazennec G., Bresson D., Lucas A., Chauveau C., Vignon F. (2001) ERβ inhibits proliferation and invasion of breast cancer cells. Endocrinology 142, 4120–4130 - PMC - PubMed

Publication types

MeSH terms